| |||||||||
1) MARKET SUMMARY: Excerpted from Thursday's paid content of "Investment House Daily" by Jon Johnson. Stocks Set To Rebound, Achieve Mixed Success
| |||||||||
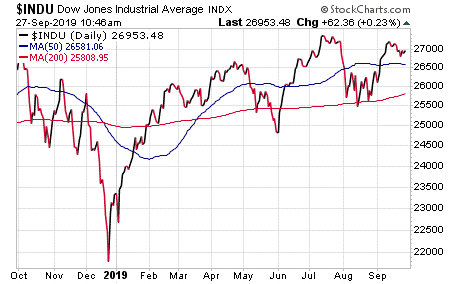
Market Summary (continued from above) After the European markets closed, the news seemed to indicate that China was buying more U.S. agricultural goods. Pending home sales jumped 1.6% versus the 1% that was expected. This was a gain of 2.48% year-over-year and the biggest yearly increase since April 2016. In the face of the impeachment debate, the American people found out that the whistleblower witnessed none of that which he complained about. Everything was hearsay that should be investigated, but won’t be. Stocks rallied into the last hour. Then, word broke that the Trump administration likely will not extend the waivers to sell to Huawei. Furthermore, China said the United States is spreading anti-Chinese sentiment in places such as Hong Kong. Well, I guess both sides have figured out that they can never have too much goodwill ahead of the October talks. S&P500 and NASDAQ: The NASDAQ and the S&P 500 look weaker, particularly the NASDAQ, as both sport upward pointing wedges that started in early 2019. Both also tested higher over the past three weeks and failed three times, if you count a half-hearted effort on Tuesday. Both have cracked the bottom of the wedge. As a refresher, stocks tend to break in the opposite direction of the point of the wedge. NOTE: The figures and information above are from the 9/26 report. Watch Market Overview Video NOTE: The video is from the 9/25 report. Here is one completed trade from Investment House Daily, offering insights into our trading strategy and the target that we have hit this week: Targets Hit This Week: Pinterest Inc. (NYSE:PINS): Many of the initial public offering (IPO) darlings from the summer are getting scorned now. However, Pinterest Inc. (PINS) is a stock that made us great upside gains in late July to August. Then, it peaked and failed a test of near support. It quickly dropped down to and even through the 50-day moving average (MA) by early September and then rebounded to test that break. That is a bear flag, and we love to play that action if the stock starts back downwards. We put the play on the report on 9/13, started to watch the action and let the test complete. Sometimes, it takes a bit of time before this kind of stock finally gives up and PINS took its time. It then decided to try one more test of the 50-day MA, showing a doji as it tested that level on the prior Friday. From there, it broke lower. On Monday, PINS hit our entry and we bought October $29.00 put options for $2.00. However, the stock dropped hard both over the course of that day and on Tuesday. After the stock fell to a lower low, it paused on Wednesday and Thursday, edging upside to test the break of that low. However, that move failed. On Friday, PINS dropped to the July low, which had been our initial target. We then sold half the options for $3.50 and banked a nice 75% gain. We are now watching to see if PINS will test the May low at $23.80. If it does, that will put our remaining options at well over a 100% gain. Receive a risk-free trial to Investment House Daily and save 50% by clicking here now! | |||||||||
2) Pick of the Week NASDAQ:SBUX (Starbucks--$90.07; -1.49; optionable) EARNINGS: 10/24/2019 STATUS: SBUX gapped to a higher high in late July, but it immediately sold back and then fell into a 6 week malaise. Good earnings, but then nothing. Two weeks back it broke the 50 day MA on big volume. It has wandered laterally below the 50 day EMA for the past two weeks. Looking for a break lower to move in to the downside position. A move to the target gains 90% on the October puts, 50%ish on the November options. VOLUME: 11.242M Avg Volume: 6.792M BUY POINT: $89.98 Volume=8M Target=$85.65 Stop=$91.32 POSITION: SBUX OCT 20 2019 90.00P - (-47 delta) or NOV 15 2019 90.00P - (-46 delta) CHART IMAGE STOCK VIDEO SUCCESS TRADING GROUP -- by the MarketFN STG Team
Subscribe to:
Post Comments (Atom)
|


No comments:
Post a Comment