Sunday, August 25, 2019

Weekender 8/28

THE WEEKEND ISSUE
Informing Investors Around The World
Read In All 50 States And Over 100 Countries
You have earned ~~VIP~~ points worth $~~VIP~~ Click here for details*
Weekend Newsletter for
August 25, 2019
Table Of Contents
1) MARKET SUMMARY from THE DAILY
2) IH ALERTS
3) SUCCESS TRADING GROUP
4) COVERED CALL SERVICE

Jon Johnson
1) MARKET SUMMARY:
Excerpted from Wednesday’s paid content of “The Daily” by Jon Johnson at InvestmentHouse.com. To get his latest information and his daily content, click here now to receive a two-week trial and save $30/month. (You won’t find this offer on the Investment House website. It is exclusively for The Weekender subscribers!)
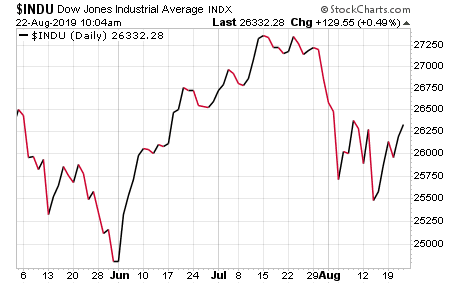
Stocks Bounce After Inverted Yield Curve
Stocks bounce right back from the Tuesday test.
Retail earnings lead the surge back upside.
FOMC minutes echo Powell’s ‘midcourse adjustment’ comments but still taken as a positive.
Indices are up another session but after all the work are still in the range.
Bond curve temporarily inverts again, no one cares. That happens.
Still work to do: Powell Friday, indices not breaking from the range. Putting all the bets on Powell to tap dance well for the market.
Market Summary (continued from above)
Earnings are still having an impact and a positive one. That happens when expectations are low as in Lowe’s. No one expected a quarter where it outshined HD. It did. TGT’s metrics were not supposed to come close to WMT. TGT destroyed all estimates. It rallied over 20%. Consumers are not showing, at least through June, any fear of recession – at the discount stores and home improvement. Look at motor homes and RV’s and you see a big drop in sales of the magnitude that has preceded the last 3 recessions.
Afterhours JWN earnings beat and that stock is higher. LB jumped at first but now trades lower; not horribly so, but lower. Perhaps JWN – expectations cannot really get lower – will also provide upside impetus. Indeed, SPY futures rallied after the close.
They also rallied before the open. Futures gapped upside on those retail earnings from TGT and LOW. Even misses such as URBN were rewarded with gains. The power of a nice surprise when nothing of note was expected.
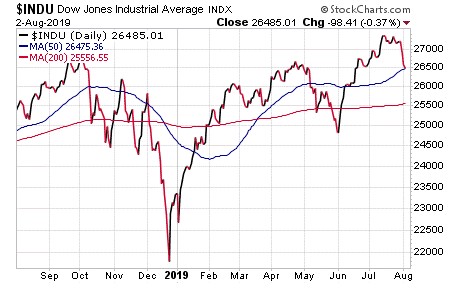
SP500, NASDAQ, DJ30: All up after the rather innocuous Wednesday fade, but all at the 50 day MA/gap point, all showing doji, all showing even lower volume. They remain at the lick log as I like to say as a holdover from my litigation days.
NOTE: The figures and information above are from the 8/21 report.
Watch Market Overview Video
Watch Technical Summary Video
Watch Next Session Video
NOTE: The videos are from the 8/21 report.
Here are two trades from “The Daily,” offering insights into our trading strategy and the targets that we have hit this week:
Chart by StockCharts.com
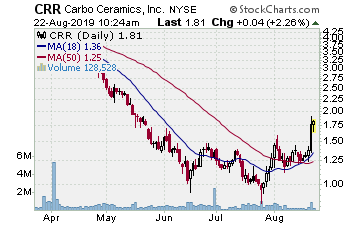
Carbo Ceramics (NYSE:CRR)
Company Profile
Double bottom with a handle. Things are so bad in oil that some are good. CRR
provides proppants for hydraulic fracturing used in horizontal drilling. Over the past 2
months CRR has formed a double bottom with handle pattern as MACD has risen in an
uptrend. Lower price lows while MACD makes a higher low — that signals momentum
turning upside. Not saying it is time to fall in love with energy, but it CRR delivers a break
upside from this pattern it has room to move. A run to the initial target gains 48%.
JP Morgan (NYSE:JPM)
Company Profile
Chart by StockCharts.com
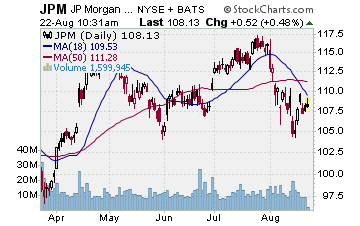
JPM put in a double top from early May to a second top in late July. Gapped
through the 50 day MA’s 8/5 and sold off to the 200 day SMA. Tried to hold then last
Wednesday JPM gapped through the 200 day SMA. With the Thursday and Friday
recovery JPM worked back up through the 200 day SMA and Monday gapped up near the
20 day EMA and near the top of the 2 week range. Faded to the 10 day EMA to close. If
JPM turns back down from here in general market weakness and renewed worries
regarding the interest rate situation (i.e. heading lower), we want to move in to some puts
for the downside. A move to the target gains 80%ish on the put options.
Targets Hit This Week:
Palomar Holdings Inc. (NASDAQ: PLMR): Not all great plays are household names that everyone recognizes. New can be, and often is, good. PLMR was a new issue in April. We always look at the first base breakout to give us an entry in a new issue because they usually yield nice gains. After its IPO, PLMR rallied to mid-May then moved laterally in a tight range for all of June and half of July. Then it started to show life, trying to make a breakout form that trading range. We put it on the report 7/19, the day it started to break higher. It edged just barely upside after that day, however, not really showing a clean break. That came, however, about a week later when it jumped up off the 10 day EMA on volume. On 7/30, the stock broke higher again and traded at $27.81 early. This stock had no options, so it was a stock only play. Once again PLM worked laterally after that move. On day five, it was up again then the same action, that slow slide laterally. Finally, a strong surge on 8/13 posting a 15% move. PLMR continued upside through Monday, gapping upside then reversing. After this kind of run that is the signal to take at least some gain. The stock was trading $36.91, fading off a gap higher; time to exit. That move gained a solid 32% on the stock
American Tower Corp. (NYSE: AMT): AMT is always a stock to watch when it sets up a pattern. And in July it did just that, a double bottom test of the 50 day MA up to the end of the month. It broke higher, stalled a bit and we used that stall to put it on the report on 8/5. The next session it was up again and time to enter. The stock asked $215.11 and the Sept. 6 $215.00 strike calls were $6.30. Sept. 6 expiration made sense given AMT’s earnings are 10/30 and there were no plans to ride it through the results. AMT continued upside the following session though the action was wild – needed to keep the bicarbonate close. The stock continued higher through the week. It then started to test the 2 week move from late July – it had rallied before we entered. AMT tested back to the 10 day EMA through 8/14, a 3-day test. It then surged the next session and climbed – with some volatility again – into this week. A good move Wednesday was followed by a gap upside Thursday and then some weakness. The options were up strong at 12.50 x 13.40 and the play had hit the target. Time to bank the gain. With a 12.85 trade it turned in a solid 100+% gain.
Receive a two week trial and if you stay on receive a $30 per month discount!
Chart by StockCharts.com
2) IH ALERTS
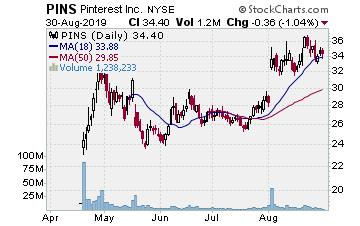
NYSE:PINS (Pinterest–$33.43; +0.03; optionable): Social
Company Profile
EARNINGS: 10/31/2019
STATUS: Pennant/Flag. A new issue in May, we are already playing PINS and are ready to put more money to work on the stock as it makes the new break higher. PINS rallied off the IPO then starting Ma formed a cup base. We picked up positions on the break higher the second half of July and enjoyed the earnings surge. Now, we want to move in when PINS completes this test of its gap upside. That could have been Thursday — the stock tested near the 10 day EMA and jumped nicely higher. Friday it was up again but slipped back to close basically flat. May want to test/consolidate the gap a bit more, letting the 10 day EMA (31.53) catch up to it. We will be patient and play it whether it fades more, moves laterally, or simply jumps higher through the entry point. A move to the target gains 14%ish on the stock, 60%ish on the options.
Volume: 2.642M Avg Volume: 4.222M
BUY POINT: $33.78 Volume=6.2M Target=$38.45 Stop=$32.23
POSITION: PINS NOV 15 2019 34.00C – (54 delta) &/or Stock
CHART IMAGE
Save $600 per year and enjoy a two week trial of our IH Alerts Service!
Chart by StockCharts.com
3) SUCCESS TRADING GROUP
— by the MarketFN STG Team
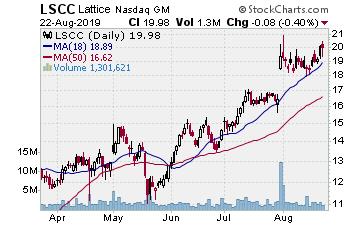
NASDAQ:LSCC (Lattice Semiconductor Corp.)
Company Profile
Our Success Trading Group members scored another winning trade when we closed out a position in Lattice Semiconductor Corp. (NASDAQ:LSCC). We are watching several other stocks and are looking forward to trading next week.
Our Success Trading Group closed seven years with zero losses on our Main Trade Table. In fact, we closed 100% winning trades for the calendar years 2016, 2015, 2013, 2012, 2011, 2010 and 2009. We still have one open position from 2017 (all others were winners) and one trade that we opened in 2014 but was closed as a losing trade.
All of these trades are posted on our Main Trade Table for your review during your free membership trial period.
Get Our Next Trade Free – Save $50 per month! Details Here.
Chart by StockCharts.com
4) COVERED CALL PLAY
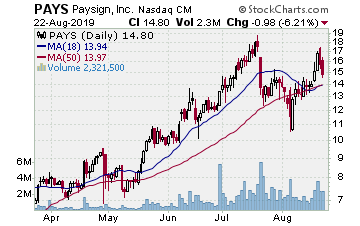
NASDAQ:PAYS — Paysign Inc. is currently trading at $41.19. The Oct. 19 $41.00 Calls (CIEN20191019C00041000) are trading at $3.05. That provides a return of about 8% if LSCC is above $41.00 by the time of the expiration.
Company Profile
Learn more about our Covered Call Tables
PREMIUM SERVICES
IH Alerts: InvestmentHouse.com’s Best of The Best Plays!
Stock Split Report: Forbes.com Best of the Web
Covered Calls: Allowed in your IRA – Energize your portfolio!
The Daily: “The Daily” is a must read for all investors!
Success Trading Group: seven years without a trading loss!
The foregoing is commentary for informational purposes only. All statements and expressions are the opinions of Online Investment Services, LP., or Split Ventures, Ltd. This information is not meant to be a solicitation or recommendation to buy, sell, or hold securities. We are not licensed or registered in the securities industry. The information presented herein and on the related web site has been obtained from sources believed to be reliable, but its accuracy is not guaranteed. The security portfolios of writers for this issue may, in some instances, include securities mentioned herein and on the related web site. Estimates, assumptions and other forward-looking information are subject to the limits of forecasting. Actual future developments may differ materially due to many factors. No one associated herewith receives compensation in any manner from any of the companies that are discussed in this newsletter or on the related websites.
This is a commerical email. It may contain advertisment or solicitation. This email was sent to ~~EMAIL~~. Please click the following link to change or unsubscribe. All Rights Reserved. 300 New Jersey Ave, Suite #500, Washington, DC 20001
NOTE: You have ~~VIP~~ VIP Points!
* Each VIP Point is worth $1 off the price of any of our monthly subscription newsletters

Sunday, August 18, 2019

Weekender 8/18

By: Jon Johnson, Editor
Copyright 2015 | All Rights Reserved
Jon Johnson is the Editor of The Daily at InvestmentHouse.com
Technorati tags:


Click Here to register our Free Weekend Newsletter - left column on home page


THE WEEKEND ISSUE
Informing Investors Around The World
Read In All 50 States And Over 100 Countries
 You have earned ~~VIP~~ points worth $~~VIP~~ Click here for details* 

Weekend Newsletter for
August 18, 2019


Table Of Contents


1) MARKET SUMMARY from THE DAILY


2) IH ALERTS


3) SUCCESS TRADING GROUP


4) COVERED CALL SERVICE

Jon Johnson

1) MARKET SUMMARY:
Excerpted from Thursday's paid content of "The Daily" by Jon Johnson at InvestmentHouse.com. To get his latest information and his daily content, click here now to receive a two-week trial and save $30/month. (You won't find this offer on the Investment House website. It is exclusively for The Weekender subscribers!)


Yield Curve Inversion Shakes Up Markets.


  • Stocks got a trade talk save, rallied and then sold. It bears noting that a stick save is not an offensive play.

  • There has not been a huge response to the "warming" trade talk, but the S&P 500 and the NASDAQ have been able to hold their support and rebound.

  • Although the expiration for many calls was on Friday, many of the large caps looked as if they could bounce to end the week. However, this didn’t answer the "base or top?" question on Friday.


Market Summary (continued from above)


Stocks looked as if they would open lower yet again as of 6:30 Eastern Time (ET) on Thursday. This was because China had come out after 4:00 p.m. ET and blustered that tariff delays were not enough to stop it from retaliating. Stocks were sold. 90 minutes later, a statement was issued that was purportedly from President Xi where he "hoped" that the United States would “meet China half way” with regards to something. I take that to mean the United States has already delayed imposing new tariffs on some goods and should just eliminate the new tariffs altogether. All of this would be one-sided for China. If I were Presidnet Trump, I would have responded that halfway would mean that China would start to buy the agricultural products it promised to at the "trade truce" several weeks back. However, all of this is simple semantics, right?


Judging by the advance in stocks, you would think a deal was just 10% away once again. In reality, as has been stated so many times, China totally reneged and walked away. Meanwhile, stocks rallied to the open, opened higher and then the entire remaining session was a case of back and forth and give and take. Then, there was an early afternoon selloff that looked a bit spooky. In the end, a rebound to the top of the range in the second half of the afternoon closed things respectably, even if the results were a bit mixed.


We had wanted a continued selloff to really heat up the downside and test those interim lows. Unfortunately, this didn’t happen. Instead, the morning news was enough to act as a pressure release valve and a lot of the fear and paranoia abated. We'll have to wait for another chance to really sell things off and work on cleaning the pipes for a better rebound rally.


S&P 500/NASDAQ: Both the S&P 500 and the NASDAQ held over the prior week's lows on Thursday’s intraday weakness and rebounded nicely to close. That indicates either the presence of buyers or a dissipation of selling at those levels. That scenario will leave them open for a rebound yet again after a sharp drop.


DJ30: The DJ30 got close to 25,250 (as it reached 25,339) and then rebounded. At one point, it was back over the 200-day simple moving average (SMA) that it gave up on Wednesday, but it could not stay there. Still, it held near that level as we birddogged a potential bounce point and could join the S&P 500 and the NASDAQ in trying to push upside on Friday.


NOTE: The figures and information above are from the 8/15 report.


Watch Market Overview Video


Watch Technical Summary Video


Watch Next Session Video


NOTE: The videos are from the 8/15 report.


Here are two trades from "The Daily," offering insights into our trading strategy and the targets that we have hit this week:


Chart by StockCharts.com
NFLX (NASDAQ: Netflix)

Company Profile


NFLX has already put in a nasty leg lower with the mid-July earnings gap that allowed it to break away down out of the seven-month trading range. NFLX rallied up to the 200-day SMA two weeks back and then rolled over. We entered that move with a downside position and banked a gain late last week when NFLX showed a doji after a cruise lower.


NFLX then jumped to the 10-day exponential moving average (EMA) on Thursday. On Friday, it rolled to the negative after trying to move through the 10-day EMA. We think NFLX is setting up a trend just below the 10-day EMA just as a breakout to the upside will set up a trend just above the 10-day EMA. Thus, we want to play further NFLX weakness to the downside. There are upside gaps from early January and those are the ones that are next in line to be filled as NFLX continues to sell. A move to the initial target will give us a 60% gain on the October puts and around a 95% gain on the September puts. It just depends on what your risk tolerance is. Again, this looks to be setting up an entrenched downtrend. Thus, we want to play the heck out of it as it continues.

DIS (NYSE: Disney)

Company Profile


Chart by StockCharts.com

Bear flag. We have a current upside play on DIS that did not help us out on the earnings as it had in April. Instead of moving up, DIS gapped lower on Wednesday due to those results and reversed a nice Tuesday jump off the 50-day moving average (MA). As of Friday, DIS tapped the 50-day EMA on its session high and backed off a bit from there to close. Its volume was lower as it moved back to its average and did not indicate that much participation in this upside move.


There is a massive upside gap from April. If the market stalls out and sells off, that gap is fully in play for a fill. Our initial target, however, is the upper gap point. That move will give us around an 80% gain on the put options. We also need to see DIS fail the rebound move, break lower through the buy point and hold the move. Now, if the market gets clobbered as a result of whatever stories are leading it around by the nose yet again, we can go ahead and take some positions without waiting for the last hour of trading.


We want to move in as it continues upward in order to capture what we can. A rally to the target will give us a gain of 10% on the stock and 55% on the options.


Targets Hit This Week:


Ulta Beauty Inc. (NASDAQ:ULTA): Some parts of the market are still holding up and rising, but many parts, including leaders, are struggling after good moves. ULTA is currently in a five-month range, so when it crashed the 50-day MA to start the month of August and rebounded to test, it looked ripe to trade a move to the downside in order to try the May low or the lower gap point from an upside gap in March. We put ULTA on the report on 8/12 as it broke back through the 50-day MA after testing from below and breaking over it for one session. During the next session, ULTA tried to rally due to that market volatility, but after kissing the 50-day SMA on the high, it started to backtrack. That was perfect as it was the time to enter. The September $335.00 strike puts were priced at $15.95 and showed a 55% delta.
The stock managed to hold a gain for the session but was way off the high by the time that the market closed. As anticipated, the market volatility remained and ULTA gapped lower on Wednesday and sold hard towards the target near the 200-day SMA. After lots of downside momentum, it was best to let it ride for the next session. ULTA started lower on Thursday and undercut the 200 day SMA. This was good, but we had to watch for the reversal near the support levels it was now touching. Sure enough, ULTA started back upside after that break. It was time to sell. The options were worth $24.60 and produced a solid 60% take on the trade to capture the test of the lower support.


Receive a two week trial and if you stay on receive a $30 per month discount!

Chart by StockCharts.com

2) IH ALERTS


NASDAQ:MTCH (Match Group--$85.63; -1.54; optionable)


Company Profile


EARNINGS: 11/05/2019


STATUS: We certainly liked how MTCH looked heading into earnings with its 12-week range long the 50-day MA. Given the fact that earnings have resulted in feast or famine, we opted to wait and let MTCH show the move, and if possible, counterpunch with plays off of that move. MTCH jumped off the 50-day MA on the earnings on Wednesday and then spent Thursday and Friday testing. On Friday, MTCH reached near the rising 10-day EMA on the low and then rebounded to a rather modest loss. It may want to come back again and fully test the 10 day. After all, stocks that breakout, such as MTCH, often put in a one-two-three test, meaning they test for three sessions and likely show a doji with a tail (typically the 10-day EMA). If that happens, perfect. At times, however, a stock will surge right up off of this setup, so we want to be ready to move in if MTCH moves higher from here. A move to the target will give us around a 15% gain on the stock and a 75% gain on the options.


VOLUME: 3.286M Avg Volume: 2.221M


BUY POINT: $87.31 Volume=3.4M Target=$99.98 Stop=$83.08


POSITION: MTCH DEC 20 2019 90.00C -- (49 delta) &/or Stock


CHART IMAGE


Save $600 per year and enjoy a two week trial of our IH Alerts Service!

Chart by StockCharts.com

3) SUCCESS TRADING GROUP

-- by the MarketFN STG Team


NYSE:SNAP (Snap Inc.)


Company Profile


Our Success Trading Group members scored another winning trade when we closed out a position in Snap Inc. (NYSE:SNAP). We are watching several other stocks and are looking forward to trading next week.


Our Success Trading Group closed seven years with zero losses on our Main Trade Table. In fact, we closed 100% winning trades for the calendar years 2016, 2015, 2013, 2012, 2011, 2010 and 2009. We still have one open position from 2017 (all others were winners) and one trade that we opened in 2014 but was closed as a losing trade.


All of these trades are posted on our Main Trade Table for your review during your free membership trial period.


Get Our Next Trade Free - Save $50 per month! Details Here.

Chart by StockCharts.com

4) COVERED CALL PLAY


NASDAQ:ATNX -- Athenex, Inc. is currently trading at $14.82. The October 19 $15.00 Calls (ATNX20191019C00015000) are trading at $1.25. That provides a return of about 13% if ATNX is above $15.00 by the time of the expiration.


Company Profile


Learn more about our Covered Call Tables
PREMIUM SERVICES
The foregoing is commentary for informational purposes only. All statements and expressions are the opinions of Online Investment Services, LP., or Split Ventures, Ltd. This information is not meant to be a solicitation or recommendation to buy, sell, or hold securities. We are not licensed or registered in the securities industry. The information presented herein and on the related web site has been obtained from sources believed to be reliable, but its accuracy is not guaranteed. The security portfolios of writers for this issue may, in some instances, include securities mentioned herein and on the related web site. Estimates, assumptions and other forward-looking information are subject to the limits of forecasting. Actual future developments may differ materially due to many factors. No one associated herewith receives compensation in any manner from any of the companies that are discussed in this newsletter or on the related websites.
This is a commerical email. It may contain advertisment or solicitation. This email was sent to ~~EMAIL~~. Please click the following link to change or unsubscribe. All Rights Reserved. 300 New Jersey Ave, Suite #500, Washington, DC 20001


NOTE: You have ~~VIP~~ VIP Points!

* Each VIP Point is worth $1 off the price of any of our monthly subscription newsletters!

Monday, August 12, 2019

Weekender 8/11

By: Jon Johnson, Editor
Copyright 2015 | All Rights Reserved
Jon Johnson is the Editor of The Daily at InvestmentHouse.com
Technorati tags:


THE WEEKEND ISSUE
Informing Investors Around The World
Read In All 50 States And Over 100 Countries
 You have earned ~~VIP~~ points worth $~~VIP~~ Click here for details* 

Weekend Newsletter for
August 11, 2019


Table Of Contents


1) MARKET SUMMARY from THE DAILY


2) IH ALERTS


3) SUCCESS TRADING GROUP


4) COVERED CALL SERVICE

Jon Johnson

1) MARKET SUMMARY:
Excerpted from Thursday's paid content of "The Daily" by Jon Johnson at InvestmentHouse.com. To get his latest information and his daily content, click here now to receive a two-week trial and save $30/month. (You won't find this offer on the Investment House website. It is exclusively for The Weekender subscribers!)


Revival After the Fall.


  • Stocks start strong, get stronger into the close in terms of point gains, solid breadth and volume.

  • Just when the pressure relented, the Trump Administration held off on licenses for selling to Huawei.

  • The fact that futures tumbled and then recovered nearly all the losses shows the presence of good market resilience thus far.

  • All eyes are on the People's Bank of China (PBOC) to set the value of the yuan. Are you serious?


Market Summary (continued from above)


A good surge that was part of the three day move that lasted though Tuesday and the first part of Wednesday was not that positive because the surge pushed the indices near those levels of potential resistance. While we were buying for sure because of the strong moves, we now have to keep an eye on those April and May highs. The S&P 500 is already within spitting distance and the DJ30 is not far off from those levels. Thus, we were both buying and looking for a continued surge in order to take some short term profits. Then, we plan to see what happens when the NASDAQ hits resistance. Those were strong days indeed and no good day goes unpunished.


After trading hours had ended, the U.S. federal government announced it was "holding off" on a decision to give licenses that would allow U.S. companies to resume business with Huawei. This decision was made in response to China deciding to halt purchases of U.S. agricultural goods. It could be a case of tat for tit or tat for tit. I'm not sure which iteration the two sides are on right now.


Now everyone is waiting to see where the self-proclaimed "non-currency manipulator" Chinese government will manipulate its currency to, i.e. where it sets the peg. Will it retaliate with a lower peg or will it surprise us all again with a higher peg as it did on Thursday? Only President Xi and his Communist Party politburo know.


DJ30: There was a solid gap and run here, even though the index is still well off 26,650 with room to run. While the Dow has some good momentum, Apple (AAPL), Caterpillar Inc. (CAT) and other China-related stocks are under some pressure post-close.


S&P 500: The S&P 500 is already at the 50-day moving average (MA) and closed at 2,938, just below the 2,950 that it achieved during the early May high. While this was a bigger move than was anticipated, this is okay as S&P 500 still has a strong volume, impressive breadth and solid leadership. It could easily cruise higher to between 2,960 and 2,980 on the strong momentum and the rally that lasted through Friday. Now, it has to deal with the Huawei issue. Futures are, however, recovering quite nicely.


NASDAQ: Another solid gap and run by a large-cap index ended with the NASDAQ closing just over the 50-day estimated moving average (EMA). As it closed at 8,039 and is looking as some serious resistance at 8,150, this course of action has left the NASDAQ room to continue higher. Shares of PowerShares QQQ Trust (QQQ) sold off aggressively after the Huawei news and then staged a very solid recovery to gain back at least half the after hours drop.


NOTE: The figures and information above are from the 8/8 report.


Watch Market Overview Video


Watch Technical Summary Video


Watch Next Session Video


NOTE: The videos are from the 8/7 report.


Here are two trades from "The Daily," offering insights into our trading strategy and the targets that we have hit this week:


Chart by StockCharts.com
GOOG (NASDAQ: Google)

Company Profile


Flag. GOOG gapped upside on earnings after gapping lower on earnings in April. Since something of an island reversal is taking shape and since the pullback to the 10-day EMA is testing the gap, it looks as if GOOG is giving us another opportunity to make money.


It already made us a sackful on the earnings. Now, we want a post-earnings play that counterpunches off the pullback to test the earnings gap. Note how it is holding just over the late April lower gap point from earnings. As this is a natural support level for the reversal, we want to move in as GOOG makes the break back up on some good volume. A move to the target will give us a gain of around 50% on the call options.


FIVN (NASDAQ: Five9)

Company Profile


Chart by StockCharts.com

FIVN gapped sharply higher on earnings, jumped off the 200-day simple moving average (SMA) and cleared a triangle. After that Thursday upside gap, it tested and came back to the June high.


On Wednesday, FIVN surged on a strong volume in what has been a solid move.


We want to move in as it continues upward in order to capture what we can. A rally to the target will give us a gain of 10% on the stock and 55% on the options.


Targets Hit This Week:


Netflix Inc. (NASDAQ:NFLX): In July, NFLX's earnings gapped the stock through the 200-day simple moving average (SMA). By that time, we were on the watch for a counterpunch play that would enable us to play off the earnings. The rebound was logical and we played that move with some September calls. We also played a further downside move after NFLX tested the 200-day average. The stock then rallied right back up to the 200-day SMA and then stalled with a doji on the candlestick chart. We put the play on the report and began looking for a drop back down from there. Since there were some upside gaps from January, we thought we could play for that as a best case scenario and could make good money without going that far. Since NFLX started lower from the 200-day SMA, we entered on 8/1 with some September $320 put options at $15.00. Then NFLX steadily declined into this week and undercut the prior low with a gap lower on Thursday. The situation looked great. Then, the market started to reverse and NFLX began to form a doji. With the overall market reversing and the fact that we already had a decent gain built in, we opted to take the gain by selling the puts for $25.80. In the end, we banked a nice 70% gain.


McDonald's Inc. (NYSE:MCD): After the lurch lower in the market, some stocks still held their support. MCD, Big Macs and all, held over the 50-day EMA and moved upside when most of the market moved lower on Tuesday. We saw that, put it on the report that night and moved in when MCD continued higher Wednesday. This was not a buy and wait forever play as we believe that the market is in a problematic position right now. Thus, upside plays are required to have quite realistic targets that don’t require a lot of movement in order to make good gains. We bought October $220 call options for $4.00. While this is perhaps a bit far out, we also realize that even in times of weaker economic activity, people still like the MCD bonus fries. MCD moved higher Wednesday and then was up again on Thursday. On Friday, when much of the market was struggling after early gains, MCD was up and hit our initial target. We sold half the position for $6.05 and banked just over 50%. This is fairly decent for less than three days.


Travelers Companies Inc. (NYSE:TRV): Similar to NFLX, TRV gapped below support at the 50-day MA in late July and then mounted a recovery to test the move. It moved up to the 50-day MA and then threw a tombstone doji. We saw that and put it on the report on 7/29. After it then broke lower during the next session, we moved in with September $145.00 put options at $3.60 since the stock was at $147.62. Then TRV slid lower again even though it bounced on 8/2. That was a one-day bounce, however, and during the next session (Monday), TRV gapped lower in what has been a typical pattern during weak Mondays as of late. That move hit our target and we sold the options for $6.33, banking a nice 75% gain.


Receive a two week trial and if you stay on receive a $30 per month discount!

Chart by StockCharts.com

2) IH ALERTS


NASDAQ:CMG CMG (Chipotle Mexican Grill--$792.21; +1.78; optionable)


Company Profile


EARNINGS: 10/22/2019


STATUS: After earnings and a good four-session move into Monday, CMG came back to fill the Monday gap and also tested the rising 10-day EMA on Thursday and Friday. The fact that there was a nice pair of doji to end the week indicates that the pullback is almost over. Clearly, CMG keeps -- cooking literally and figuratively -- even if the overall market is struggling. We want to move in as CMG breaks higher through our entry point. A move to the target will give us a gain of around 50% on the call options.


VOLUME: 402.447K Avg Volume: 470.445K


BUY POINT: $794.82 Volume=650K Target=$844.94 Stop=$778.12


POSITION: CMG NOV 15 2019 800.00C -- (52 delta)


CHART IMAGE


Save $600 per year and enjoy a two week trial of our IH Alerts Service!

Chart by StockCharts.com

3) SUCCESS TRADING GROUP

-- by the MarketFN STG Team


NYSE:CHWY (Chewy, Inc.)


Company Profile


Our Success Trading Group members scored another winning trade when we closed out a position in Chewy, Inc. (NYSE:CHWY). We are watching several other stocks and are looking forward to trading next week.


Our Success Trading Group closed seven years with zero losses on our Main Trade Table. In fact, we closed 100% winning trades for the calendar years 2016, 2015, 2013, 2012, 2011, 2010 and 2009. We still have one open position from 2017 (all others were winners) and one trade that we opened in 2014 but was closed as a losing trade.


All of these trades are posted on our Main Trade Table for your review during your free membership trial period.


Get Our Next Trade Free - Save $50 per month! Details Here.

Chart by StockCharts.com

4) COVERED CALL PLAY


NASDAQ:PAYS -- Paysign Inc. is currently trading at $13.06. The September 21 $12.50 Calls (PAYS20190921C00012500) are trading at $2.15. That provides a return of about 17% if PAYS is above $12.50 by the time of the expiration.


Company Profile


Learn more about our Covered Call Tables
PREMIUM SERVICES

The foregoing is commentary for informational purposes only. All statements and expressions are the opinions of Online Investment Services, LP., or Split Ventures, Ltd. This information is not meant to be a solicitation or recommendation to buy, sell, or hold securities. We are not licensed or registered in the securities industry. The information presented herein and on the related web site has been obtained from sources believed to be reliable, but its accuracy is not guaranteed. The security portfolios of writers for this issue may, in some instances, include securities mentioned herein and on the related web site. Estimates, assumptions and other forward-looking information are subject to the limits of forecasting. Actual future developments may differ materially due to many factors. No one associated herewith receives compensation in any manner from any of the companies that are discussed in this newsletter or on the related websites.

This is a commerical email. It may contain advertisment or solicitation. This email was sent to ~~EMAIL~~. Please click the following link to change or unsubscribe. All Rights Reserved. 300 New Jersey Ave, Suite #500, Washington, DC 20001


NOTE: You have ~~VIP~~ VIP Points!

* Each VIP Point is worth $1 off the price of any of our monthly subscription newsletters! 


Tuesday, August 06, 2019

Weekender for 8/4

By: Jon Johnson, Editor
Copyright 2015 | All Rights Reserved
Jon Johnson is the Editor of The Daily at InvestmentHouse.com
Technorati tags:


THE WEEKEND ISSUE
Informing Investors Around The World
Read In All 50 States And Over 100 Countries
 You have earned ~~VIP~~ points worth $~~VIP~~ Click here for details* 

Weekend Newsletter for
August 4, 2019


Table Of Contents


1) MARKET SUMMARY from THE DAILY


2) IH ALERTS


3) SUCCESS TRADING GROUP


4) COVERED CALL SERVICE

Jon Johnson

1) MARKET SUMMARY:
Excerpted from Thursday's paid content of "The Daily" by Jon Johnson at InvestmentHouse.com. To get his latest information and his daily content, click here now to receive a two-week trial and save $30/month. (You won't find this offer on the Investment House website. It is exclusively for The Weekender subscribers!)


Tariff Drama Returns.


  • President Trump plays the tariff card to pressure Jerome Powell, and in doing so, slams shut a very credible relief move in the market. Meanwhile, the three month/10 year inversion in Treasury constant maturities has continued to expand.

  • The market has become susceptible to every headline as investors are now looking for problems instead of opportunities.

  • The indices are closing in on the 50-day moving averages (MAs). That could lead to a bounce and likely not much more.

  • The rotation into small and midcaps has disappeared faster than it had showed up.

  • The market's leaders were powering back up, but now have been hammered back down.


Market Summary (continued from above)


Stocks appeared to have overreacted to the Federal Open Market Committee (FOMC) decision, at least in the minds of investors. Futures swung modestly higher in a relief move which had reacted to the Wednesday afternoon selling. Then, stocks caught a bid when the market opened on Thursday and improved through the first half of the day. NASDAQ topped the Wednesday intraday high and stocks such as the Lam Research Corporation (LRCX), Applied Materials Inc. (AMAT), Alphabet Inc.(GOOG), Facebook (FB) and Twitter (TWTR) put in solid moves by moving past their Wednesday highs as well. Certainly, it looked as if the market had reassessed the FOMC half-measure move, found it palatable and allowed the bids to return.


This fact remained true even when earnings were not all that great to start the day. Indeed, there were lots of top-line misses such as Verizon (VZ), Clorox Co. (CLX), Dunkin Brands Group Inc. (DNKN) and Qualcomm (QCOM). This seemed like a return to the trend that we saw back in the financial crisis "recovery" days. It is also a leading indicator of trouble ahead as profits necessarily get squeezed when there are top-line misses. Since profits (P) equals investment (I) equals growth (G), if P starts to decline, G declines. Then, stock prices and the economy follow suit. Nonetheless, investors overlooked that and decided a 25 basis point cut was better than a poke in the eye with a sharp stick and bought stocks.


Then the other shoe dropped. President Trump announced a new 10% tariff on the remaining $300 billion of Chinese imports. Stocks dropped as if they had been shot. The DJ30 dropped 560+ points in just over one hour and the NASDAQ dropped 230 points.


DJ30: You know, when I said earlier in the week and over the previous weekend that the Dow was at a point where it needed to make that break from its three-week consolidation or trouble might ensue, I really didn’t believe it would break down. However, it did. Now, it is just over the 50-day simple moving average (SMA) and selling on its big volume. As with the NASDAQ, it will have a chance to bounce here, but the quality of the bounce will reveal everything. While I am not expecting it to be all that great, then again I did not think that the Thursday bounce would be as good as it was BT (before Trump).


S&P 400: The S&P 500 gapped lower, experienced a modest bounce and then slammed down through the 50-day exponential moving average (EMA) and close to the 1,920 50-day EMA and support.


NASDAQ: NASDAQ flipped from an excellent recovery off the Wednesday Fed-induced selling by rallying 135+ points. Then, the monkey hammered. By the time that the market closed, it had given up that early July break to the new all-time highs. Those new highs had been hit and held for three weeks or so. Then, two hard days and it, along with much more, were all gone. Those are the kind of reversals that you have to take seriously. Since the NASDAQ is just over the 50-day EMA by 65 points, it will try again there, and with the two main issues decided for the moment, perhaps the bids will resume if the Jobs Report is just right. This means that the report cannot be either too strong or somewhat disappointing with more weakness than has been believed. In this market, that will be a Fed positive, and a Fed positive is the best upside impetus in the current market.


NOTE: The figures and information above are from the 8/1 report.


Watch Market Overview Video


Watch Technical Summary Video


Watch Next Session Video


NOTE: The videos are from the 8/1 report.


Here are two trades from "The Daily," offering insights into our trading strategy and the targets that we have hit this week:


Chart by StockCharts.com
NFLX (NASDAQ: Netflix)

Company Profile


Bear flag. NFLX broke hard on earnings with a breakaway gap through the 200-day SMA that marked the bottom of NFLX's six-month trading range. Although it has a huge volume on the gap below the resistance, a breakaway gap exists to the downside. As you know, breakaway gaps tend to run in the direction of the gap.


Of course, NFLX rebounded to test the 200-day SMA. On Monday, it had just waffled to below that resistance. If NFLX breaks hard through the buy point and on some volume, we want to play it lower. A move to the target will give us around 95% on the put options.


TRV (NYSE: The Travelers Companies Inc.)

Company Profile


Chart by StockCharts.com

Bear flag. TRV put in a steady trend higher off the December 2018 low. It then entered a period of nice action with periodic tests of the 50-day MA. On this last test, TRV broke below the 50-day MA on strong volume. Then, it rebounded to test and moved up over the 50-day MA before reversing when the market closed.


It is now consolidating again in a tight lateral range while it waits for the 10-day EMA to catch up and start the next move upward.


If TRV breaks lower from here, we want to play a move to the next lower support. That move will gain us around 80% on the options.


Targets Hit This Week:


Apple, Inc. (NASDAQ:AAPL): We picked up AAPL after an earnings move on 7/3 by buying August $200.00 call options for $9.65. The idea was to see if we could get a pre-earnings run and then wait to see what Apple's earnings looked like. Then, we would decide if we wanted to ride some shares through. Initally, AAPL remained slow-going for some time. Then, it experienced a slow move to the upside and trended higher up the 10-day EMA. This meant that, right before earnings, we had a modest gain built into the position as AAPL's share price had moved up ahead of its earnings report. We also already knew that AAPL had popped on its April results and then immediately suffered a sell-off. Thus, we opted to sell the position for $11.20 and banked a very modest 16% gain. Well, AAPL did get a pop and jumped in the first few minutes of trading. The options then traded up to near $19.00 and immediately dropped. While we could have made a handsome profit, we were straight on the calls and did not have a spread going forward, we decided this one was too risky for the anticipated move that the options were showing. As it turned out, this would have been a good play. However, the odds were not in our favor as much.


Pinterest Inc. (NYSE:PINS): This was one of our favorite plays. After all of the fluff from the early initial public offering (IPO) trade is out, then the share price will settle into a base. When the base hits the buy point, the share price can fly. We moved in on 7/24 as PINS broke higher over the 50-day EMA on its base As this was a very logical buy point, we bought stock for $27.96 and some September $27.00 call options for $2.65. PINS then consolidated for a couple of sessions after the break and moved higher on 7/31. It tested on 8/1, ahead of its earnings report. Our play was to ride through earnings on this one, and it paid off as PINS shares beat and jumped. We sold half the stock for $33.40 and banked a 19% gain. We then sold the options for $6.70 and banked over 150%.


Receive a two week trial and if you stay on receive a $30 per month discount!

Chart by StockCharts.com

2) IH ALERTS


NASDAQ:AMZN Amazon (Amazon.com--$1866.78; -31.75; optionable)


Company Profile


EARNINGS: 10/24/2019


STATUS: AMZN has been down for four sessions and it may try a relief move. However, we want to be ready if the big tech companies continue to get sold. On Wednesday, AMZN broke below the 50-day SMA on a big volume. After reaching a lower moving average convergence/divergence (MACD) and a lower volume peak in early July, AMZN may just want to go down and test the 200-day SMA. We want to play that move. The question is whether AMZN will do so from here or after a bounce. We are ready to enter at least a partial position if AMZN's share price continues to decline. If it bounces a bit first, that is good, too. We will then play it off a failed test of the 50-day MA. A move to the target from the Wednesday close will give us around 50% on the put options.


VOLUME:4.325M Avg Volume: 3.251M


BUY POINT: $1,864.64 Volume=3.8M Target=$1,715.55 Stop=$1,894.57


POSITION: AMZN OCT 18 2019 1,865.00P -- (-46 delta)


CHART IMAGE


Save $600 per year and enjoy a two week trial of our IH Alerts Service!

Chart by StockCharts.com

3) SUCCESS TRADING GROUP

-- by the MarketFN STG Team


NYSE:CHWY (Chewy, Inc.)


Company Profile


Our Success Trading Group members scored another winning trade this week when we closed out a position in Chewy, Inc. (NYSE:CHWY). We are watching other several stocks and are looking forward to trading next week.


Our Success Trading Group closed seven years with zero losses on our Main Trade Table. In fact, we closed 100% winning trades for the calendar years 2016, 2015, 2013, 2012, 2011, 2010 and 2009. We still have one open position from 2017 (all others were winners) and one trade that we opened in 2014 but was closed as a losing trade.


All of these trades are posted on our Main Trade Table for your review during your free membership trial period.


Get Our Next Trade Free - Save $50 per month! Details Here.

Chart by StockCharts.com

4) COVERED CALL PLAY


NASDAQ:VG -- Vonage Holdings Corp. is currently trading at $12.07. The August 17 $12.00 Calls (VG20190817C00012000) are trading at $0.75. That provides a return of about 7% if VG is above $12.00 by the time of the expiration.


Company Profile


Learn more about our Covered Call Tables
PREMIUM SERVICES

The foregoing is commentary for informational purposes only. All statements and expressions are the opinions of Online Investment Services, LP., or Split Ventures, Ltd. This information is not meant to be a solicitation or recommendation to buy, sell, or hold securities. We are not licensed or registered in the securities industry. The information presented herein and on the related web site has been obtained from sources believed to be reliable, but its accuracy is not guaranteed. The security portfolios of writers for this issue may, in some instances, include securities mentioned herein and on the related web site. Estimates, assumptions and other forward-looking information are subject to the limits of forecasting. Actual future developments may differ materially due to many factors. No one associated herewith receives compensation in any manner from any of the companies that are discussed in this newsletter or on the related websites.

This is a commerical email. It may contain advertisment or solicitation. This email was sent to ~~EMAIL~~. Please click the following link to change or unsubscribe. All Rights Reserved. 300 New Jersey Ave, Suite #500, Washington, DC 20001


NOTE: You have ~~VIP~~ VIP Points!

* Each VIP Point is worth $1 off the price of any of our monthly subscription newsletters!