2) Pick of the Week
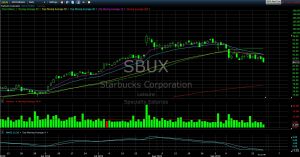
NASDAQ:SBUX (Starbucks--$90.07; -1.49; optionable)
EARNINGS: 10/24/2019
STATUS: SBUX gapped to a higher high in late July, but it immediately sold back and then fell into a 6 week malaise. Good earnings, but then nothing. Two weeks back it broke the 50 day MA on big volume. It has wandered laterally below the 50 day EMA for the past two weeks. Looking for a break lower to move in to the downside position. A move to the target gains 90% on the October puts, 50%ish on the November options.
VOLUME: 11.242M Avg Volume: 6.792M
BUY POINT: $89.98 Volume=8M Target=$85.65 Stop=$91.32
POSITION: SBUX OCT 20 2019 90.00P - (-47 delta) or NOV 15 2019 90.00P - (-46 delta)
CHART IMAGE
STOCK VIDEO
SUCCESS TRADING GROUP
-- by the MarketFN STG Team
Here is a completed trade from the Success Trading Group, offering insights into our trading strategy and the targets that we have hit this week:
NYSE:SNAP (Snap Inc.)
Our Success Trading Group members scored another winning trade when we closed out a position in Snap Inc. (NYSE: SNAP). We are watching several other stocks and are looking forward to trading next week.
Our Success Trading Group closed seven years with zero losses on our Main Trade Table. In fact, we closed 100% winning trades for the calendar years 2016, 2015, 2013, 2012, 2011, 2010 and 2009. We still have one open position from 2017 (all others were winners) and one trade that we opened in 2014 but was closed as a losing trade.
All of these trades are posted on our Main Trade Table for your review during your free membership trial period.
For Success Trading Group samples, click here!
|
____________________________________________________
4) COVERED CALL PLAY
Coherus Biosciences Inc. (NASDAQ:CHRS) -- Coherus Biosciences Inc. is currently trading at $20.86. The November 16 $20.00 Calls (CHRS20191116C00020000) are trading at $2.80. That provides a return of about 14% if CHRS is above $20.00 by the expiration.
Learn more about our Covered Call Tables |
| PREMIUM SERVICES |
The foregoing is commentary for informational purposes only. All statements and expressions are the opinions of Online Investment Services, LP., or Split Ventures, Ltd. This information is not meant to be a solicitation or recommendation to buy, sell, or hold securities. We are not licensed or registered in the securities industry. The information presented herein and on the related web site has been obtained from sources believed to be reliable, but its accuracy is not guaranteed. The security portfolios of writers for this issue may, in some instances, include securities mentioned herein and on the related web site. Estimates, assumptions and other forward-looking information are subject to the limits of forecasting. Actual future developments may differ materially due to many factors. No one associated herewith receives compensation in any manner from any of the companies that are discussed in this newsletter or on the related websites.
This is a commerical email. It may contain advertisment or solicitation. This email was sent to ~~EMAIL~~. Please click the following link to change or unsubscribe. All Rights Reserved. 300 New Jersey Ave, Suite #500, Washington, DC 20001 |
NOTE: You have ~~VIP~~ VIP Points!
* Each VIP Point is worth $1 off the price of any of our monthly subscription newsletters!
|
|

THE WEEKEND ISSUE |
| Informing Investors Around The World |
| Read In All 50 States And Over 100 Countries |
| You have earned ~~VIP~~ points worth $~~VIP~~ Click here for details* |
Weekend Newsletter for
September 22, 2019
Table Of Contents
1) MARKET SUMMARY from THE DAILY
2) IH ALERTS
3) SUCCESS TRADING GROUP
4) COVERED CALL SERVICE
|  |
|
1) MARKET SUMMARY:
Excerpted from Thursday's paid content of "Investment House Daily" by Jon Johnson.
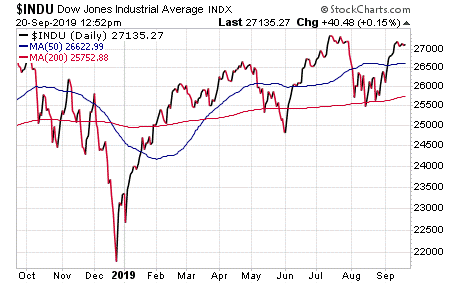
Stocks Started Strongly, But Gave Up the Gains With a Disappointing Close
- Stocks moved from lows to highs, but the gains faded.
- The S&P500 tested near the high and faded again. Other indices mimiced this action.
- In other news, the Fed has the market’s back, the economic data are neither bad nor great. While the stocks are set up to move, they cannot.
- There wasn't a selloff. Investors just were not ready to make the move.
|
Market Summary (continued from above)
This week, we had the Fed cutting rates and also ready to try quantitative easing (QE). We also had housing starts at a 12-year high, existing home sales reaching their strongest level since March 2018 and consumption all coming to a head this week. Again, it is hard to imagine what would undermine the Fed bid. What about the reposession (repo) market going crazy? It's possible. The Federal Open Market Committee (FOMC) is at risk of losing control of the short end of the yield curve, which is the end it controls.
Trade was another issue. Indeed, trade was credited with a weakening market after midday on Thursday. This was when one of President Trump's close trade advisors opined that tariffs could go to 50% or even 100% if the United States needed to retaliate. Perhaps that was the problem, even though it seemed more as if he was throwing out ideas versus stating policy.
In the end, the situation when the indices closed was mixed. This is not surprising as the large-cap indices were affected by Microsoft's (MSFT) gap higher and the gains that had occurred earlier in the session.
S&P500: We saw a reach below the 10-day exponential moving average (EMA) and the 2019 trendline, followed by a reversal to a modest gain on a rising and above-average volume. This situation shows that buyers were moving in as the S&P500 rebounded off the lows and was back above the key near-term support.
NASDAQ: There was a reach below the 10-day EMA that went down near the 50-day simple moving average (SMA) and then a rebound to a flat trajectory due to a rising average volume. Buyers came in on the lows and rallied the NASDAQ back up 89 points when the markets closed.
NOTE: The figures and information above are from the 9/19 report. The discussion on the indexes is from the 9/18 report.
Watch Market Overview Video
Watch Technical Summary Video
Watch Next Session Video
NOTE: The videos are from the 9/18 report.
Here are two completed trades from "The Daily," offering insights into our trading strategy and the targets that we have hit this week:
Targets Hit This Week:
TherapeuticsMD Inc. (NASDAQ:TXMD): We spotted TXMD in early September as one of the "turning the corner" plays. These are plays where the stock has trended lower for quite some time and then made its turn to break the downtrend. It broke over the 50-day MAs and tested into early September by coming back to those 50-day MAs as support. We put it on the report and started to look for the break higher to signal our entry. Piece of cake, right? Well, this one was. TXMD broke sharply higher on 9/9. We entered this play, which was a stock play due to the stock price, at $3.09. From there, it was pretty much a straight upside to 9/17 and a rendezvous with the 200-day SMA. Then, TXMD hit the 200-day, stalled and showed a doji. Since it was time to bank the gain, we sold the position for $3.80 and banked a 22% gain.
SM Energy Co. (NYSE:SM): This trade was a bit bumpier. Oil stocks were rising already and the attack on the Saudi production facility enhanced our interest. We moved in when SM's shares broke higher over the 50-day EMA on 9/9. We bought the stock for $11.07 and the November $10.00 calls for $2.05. We chose the November calls because we wanted to ride this one into its October earnings announcement. Well, that wasn’t the case because SM rallied during the next session. Then, it faded and faded again. SM then sold to the 50-day SMA as of 9/8 and we were ready to close it if it could not bounce. On 9/16, it bounced quite well. SM gapped upside and ran over $12.80 on the high. Then it stalled. After we did a quick assessment of the oil sector and saw most moves stalling, we quickly decided to close the position. We then sold the stock for $12.62 and banked a 14% gain. Concurrently, we sold the November calls for $3.10 and banked a 51% gain. While we are no longer riding it through to its earnings, this was a decent gain under the current market conditions. As it turns out, SM flopped Tuesday and made our decision to take profits even better.
Receive a two week trial and if you stay on receive a $30 per month discount!
|
2) IH ALERTS
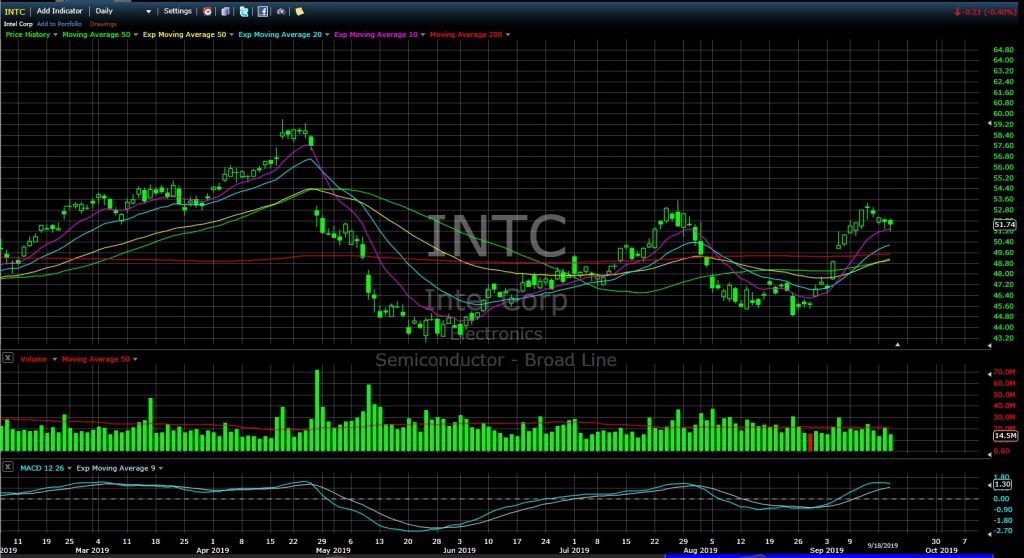
NASDAQ:INTC (Intel -- $51.74; -0.21; optionable)
Company Profile
EARNINGS: 10/24/2019
STATUS: This was a familiar pattern as it took the form of a short eight-week cup with a handle that is part of a larger base that formed after INTC peaked in late April. Last week, INTC rallied back up to the late July highs that it hit just before this cup base started. After a doji last Thursday, INTC faded to the 10-day EMA, tested it throughout Tuesday and Wednesday and bounced up from it when the markets closed on Wednesday. Thus, we believe that the stock will be ready if not already primed. We want to play the break back upside when it posts a strong move through the entry point and stays there. A rally to the target at the April upside gap point will give us a solid 95% gain on the options.
VOLUME: 15.03M Avg Volume: 22.392M
BUY POINT: $52.22 Volume=25M Target=$56.54 Stop=$50.79
POSITION: INTC NOV 15 2019 52.50C -- (48 delta) &/or Stock
CHART IMAGE
Save $600 per year and enjoy a two week trial of our IH Alerts Service!
|
3) SUCCESS TRADING GROUP
-- by the MarketFN STG Team
NYSE:SM (SM Energy Co.)
Company Profile
Our Success Trading Group members scored another winning trade when we closed out a position in SM Energy Co. (NYSE: SM). We are watching several other stocks and are looking forward to trading next week.
Our Success Trading Group closed seven years with zero losses on our Main Trade Table. In fact, we closed 100% winning trades for the calendar years 2016, 2015, 2013, 2012, 2011, 2010 and 2009. We still have one open position from 2017 (all others were winners) and one trade that we opened in 2014 but was closed as a losing trade.
All of these trades are posted on our Main Trade Table for your review during your free membership trial period.
Get Our Next Trade Free - Save $50 per month! Details Here.
|
4) COVERED CALL PLAY
Adma Biologics Inc. (NASDAQ:ADMA) -- Adma Biologics Inc. is currently trading at $5.25. The November 16 $5.00 Calls (ADMA20191116C00005000) are trading at $0.75. That provides a return of about 16% if ADMA is above $5.00 by the expiration.
Company Profile
Learn more about our Covered Call Tables |
| PREMIUM SERVICES |
The foregoing is commentary for informational purposes only. All statements and expressions are the opinions of Online Investment Services, LP., or Split Ventures, Ltd. This information is not meant to be a solicitation or recommendation to buy, sell, or hold securities. We are not licensed or registered in the securities industry. The information presented herein and on the related web site has been obtained from sources believed to be reliable, but its accuracy is not guaranteed. The security portfolios of writers for this issue may, in some instances, include securities mentioned herein and on the related web site. Estimates, assumptions and other forward-looking information are subject to the limits of forecasting. Actual future developments may differ materially due to many factors. No one associated herewith receives compensation in any manner from any of the companies that are discussed in this newsletter or on the related websites.
This is a commerical email. It may contain advertisment or solicitation. This email was sent to ~~EMAIL~~. Please click the following link to change or unsubscribe. All Rights Reserved. 300 New Jersey Ave, Suite #500, Washington, DC 20001 |
NOTE: You have ~~VIP~~ VIP Points!
* Each VIP Point is worth $1 off the price of any of our monthly subscription newsletters!
|
|

THE WEEKEND ISSUE |
| Informing Investors Around The World |
| Read In All 50 States And Over 100 Countries |
| You have earned ~~VIP~~ points worth $~~VIP~~ Click here for details* |
Weekend Newsletter for
September 15, 2019
Table Of Contents
1) MARKET SUMMARY from THE DAILY
2) IH ALERTS
3) SUCCESS TRADING GROUP
4) COVERED CALL SERVICE
|
 |
|
1) MARKET SUMMARY:
Excerpted from Thursday's paid content of "The Daily" by Jon Johnson at InvestmentHouse.com. To get his latest information and his daily content, click here now to receive a two-week trial and save $30/month. (You won't find this offer on the Investment House website. It is exclusively for The Weekender subscribers!)
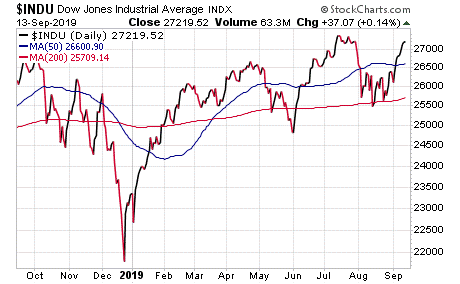
Inflation Returns.
- While positive trade news abounds, after the current move, the market is not that peppy.
- SOX recently touched a new high and then backed down.
- A lot of good news has been priced in as the indices have tested their resistance.
- The CPI core has hit an 11-year high just as the Fed is set to cut rates again. As the Fed now loves inflation, will it surprise the market?
|
Market Summary (continued from above)
The trade news on Wednesday did provide some upside impetus, but not the
caliber that was indicated from the futures surge that night. Instead, the stock indices gapped higher and
rallied a bit more with the S&P 500 roughly seven points from its prior all-time high. Meanwhile, the DJ30 closed within
100 points of its all-time peak.
In other words, it was not a powerful surge. As noted, the indicies gapped upside, rallied and
then faded to the opening prices. While we can still get quite solid gains even though the indexes are a bit lethargic, we will have to tap
at them from a distance versus running up and trying to kick the door in.
Not only did President Trump's comments about forestalling higher tariffs on
$250 billion of goods for two weeks make an impact on the markets, the Chinese government supposedly stated that it was thinking of
loosening its ban on importing U.S. agricultural products.
S&P500: It gapped to a tight doji and came within eight points of the all-time high, experienced a solid volume and then moved up a bit more. While there may have been some churn, there is nothing nefarious about this
move. Instead, it was just some solid upside that had simply got a bit extended. However, the index can get even more
extended upside and break to a new high. Then, after that move runs its course after a
few sessions, a test of the break will set up new upside opportunities.
NASDAQ: It gapped over the April 2019 and August 2018 highs. Then, it moved into the July
range which holds the all-time high before backing off to a doji. While this is evidence of a good move in progress, the NASDAQ is still
lagging behind the other large cap indices by a bit.
NOTE: The figures and information above are from the 9/11 report.
Watch Market Overview Video
Watch Technical Summary Video
Watch Next Session Video
NOTE: The videos are from the 9/10 report.
Here are some trades from "The Daily," offering insights into our trading strategy and the targets that we have hit this week:
Targets Hit This Week:
With the nice surge from the bottom of the trading range to the verge of new highs, of course it was a week to bank gain – upside AND downside.
Upside:
Carbo Ceramics Inc.(NYSE:CRR): We saw CRR setting up at the 50-day moving average (MA) last weekend and starting a break higher on some good volume. We then decided to put it on the report as the oil and gas sector has formed up well for at least some short rallies. On Monday, CRR hit the entry point with a solid move and we picked up the stock for $1.87. This proved to be a good, clean pick as CRR surged into Thursday and rallied to test the 200-day simple moving average (SMA). That rang the bell on our target, and as CRR was just below the 200-day SMA with a doji, we sold the position for $2.66 and banked a gain of 42%. Now, we will have to see if CRR will form up a good pattern at the 200-day SMA.
Nordstrom, Inc.(NYSE:JWN) : While several market leaders in the retail sector have hit new highs, other areas of retail have "turned the corner" after long declines. Now, they are breaking downward trends and posting excellent moves. We always watch for these stocks as the returns can be significant in a short period of time. We saw JWN over the weekend and put it on the report. On Monday, JWN continued its break over the 50-day MA and we bought some stock at $31.86 and some October $30.00 call options for $2.80. The momentum on the turn from the lows -- and a nifty little inverted head and shoulders -- was strong. Then, JWN ran right up to near our target by Thursday. It was showing a doji, and after a seven-session move higher, that was a good signal to bank some gains. So, we sold some stock for $34.64 and an 8.71% gain. We also sold part of the options for $5.00 and banked a 78% gain.
Nvidia Corporation (NASDAQ:NVDA): We watched NVDA form a long six-month triangle base and waited for an entry. In late August, it put in a higher low at the 200-day SMA inside the pattern. We always watch for that because a higher low at such support typically leads to a breakout move from the pattern. So, when NVDA broke higher off the 200-day SMA on 8/29, we moved in with some October $165.00 call options for $10.55. While NVDA moved higher, it then tested once more in the base and experienced a short dip to the 50-day MA. From there it shot higher and broke out from the pattern two Thursdays ago. NVDA then walked higher into Thursday, gapped upside and brushed our target. We sold some options for $22.05 and banked 110%.
Texas Instruments Inc. (NASDAQ: TXN): TXN broke higher from a two-month triangle on 9/5, but could not move forward. It tested into Tuesday and then came back to test the trendline and the 10-day exponential moving average (EMA). We saw that move and recognized it as a great entry for a continued breakout move -- chips were strong and we assumed that TXN would follow higher. As a result, we picked up some October $125.00 call options for $4.85. Then, TXN made a quick move higher into Thursday. While it still looked strong, many chips were stalling after good moves. So, we banked half the options for $6.95 and took a 43% gain in less than three sessions. If this pattern continues, we still have half the position to carry us forward.
Urban Outfitters, Inc. (NASDAQ:URBN): This is another one of those retailers that trended lower before finally turning the corner so that it could be ready to rally. We saw URBN break the 50-day MA a week earlier before it then faded to the test. After it showed a nice tight doji last Wednesday, we put it on the report. On 9/5, URBN surged off the test and we moved in with some stock at $24.71 and some October $23.00 call options for $2.40. URBN made one test during the next session and then it was all upside into Thursday. After the stock showed a doji on Thursday after the strong move, it was time to bank some gains. As a result, we sold some stock for $26.51 and a 7.2% gain. We also sold half the options for $3.70 and banked 54%.
Downside:
Arena Pharmaceuticals, Inc. (NASDAQ: ARNA): ARNA crashed the 50-day MA in early August after a steady rally up the 20-day MA. We then watched it recover and then stall when it got back to the 50-day MA. We put it on the report when it started to stall. Two sessions later, RNA broke lower and failed in its recovery attempt. Then, we moved in with some October $55.00 put options for $4.60. It was a slow process, but ARNA steadily sold below the 10-day EMA into Tuesday. This was when it hit the 200-day SMA and held. Since this was our target, we sold the options for $6.50 and a 40% gain.
American Express Company (NYSE: AXP) : AXP was an exhausting downside play. We entered as it reversed an upside move, breaking below the 50-day MA the day after it jumped off that support. We entered with some September $120.00 puts for $2.46 on 8/14. That was the start of the volatile odyssey as AXP initally sold and then reversed again back over the 50-day MA. It then gapped lower below the 50-day MA during the next session. Then, it dove lower during the last half of August and then bounced back and forth below the 20-day EMA for over two weeks, constantly and slowly trending ever lower. Finally on Tuesday, AXP gapped and sold back to the prior lows. When it held at this position, we sold the puts for $3.30 and banked a 34% gain that was barely worth the amount of time we spent watching this play.
Verisign, Inc. (NASDAQ:VRSN) : VRSN made us so much money on its incredible long run upward. When it broke the 50-day MA in early August, we saw the stock's character change. Thus, we flipped our attention to using VRSN to make us money on the downside. It tested the move with a bear flag that stalled at the 50-day MA. We put it on the report and it gapped down from the 50-day MA on 8/12. At this point, we entered with some October $210.00 put options for $10.80. VRSN immediately rebounded to test the 50-day MA again. From there, it gapped to a lower low -- ah the volatility -- and having a spread to churn on it would have been great. VRSN then bounced up and down -- always below the 50-day MA -- for the next three weeks. This week, VRSN finally gave up after wearing itself out. It tumbled on Monday, Tuesday and Wednesday and finally hit our target when the markets closed on Wednesday. Since we saw a support in the form of the rising 200-day MA, we sold the position for $18.85 and a gain of 74%.
Receive a two week trial and if you stay on receive a $30 per month discount!
|
2) IH ALERTS
NYSE:GS (Goldman Sachs--$207.21; +0.15; optionable)
Company Profile
EARNINGS: 10/15/2019
STATUS: Goldman showed a doji on Friday after a nice Thursday gap higher through the 50-day EMA and up to the 50-day SMA.
The stock then paused with a doji on Friday and took a breather after an
important move. After all, that move on Thursday gapped GS over the four-week range which had formed over
the 200-day SMA after the early August meltdown. We want to play a resumption of the
break higher up to the bottom of the late July lateral consolidation range. That move will give us
a solid 75% gain on the options.
VOLUME: 1.439M Avg Volume: 2.073M
BUY POINT: $208.28 Volume=3.1M Target=$218.31 Stop=$204.92
POSITION: GS OCT 18 2019 210.00C - (45 delta) &/or Stock
Video
CHART IMAGE
Save $600 per year and enjoy a two week trial of our IH Alerts Service!
|
3) SUCCESS TRADING GROUP
-- by the MarketFN STG Team
NASDAQ:LSCC (Lattice Semiconductor Corp.)
Company Profile
Our Success Trading Group members scored another winning trade when we closed out a position in Lattice Semiconductor Corp. (NASDAQ: LSCC). We are watching several other stocks and are looking forward to trading next week.
Our Success Trading Group closed seven years with zero losses on our Main Trade Table. In fact, we closed 100% winning trades for the calendar years 2016, 2015, 2013, 2012, 2011, 2010 and 2009. We still have one open position from 2017 (all others were winners) and one trade that we opened in 2014 but was closed as a losing trade.
All of these trades are posted on our Main Trade Table for your review during your free membership trial period.
Get Our Next Trade Free - Save $50 per month! Details Here.
|
4) COVERED CALL PLAY
Seabridge Gold Inc. (NYSE:SA) -- Seabridge Gold Inc. is currently trading at $13.49. The November 16 $13.00 Calls (SA20191116C00013000) are trading at $1.25. That provides a return of about 10% if SA is above $13.00 by the time of the expiration.
Company Profile
Learn more about our Covered Call Tables |
| PREMIUM SERVICES |
The foregoing is commentary for informational purposes only. All statements and expressions are the opinions of Online Investment Services, LP., or Split Ventures, Ltd. This information is not meant to be a solicitation or recommendation to buy, sell, or hold securities. We are not licensed or registered in the securities industry. The information presented herein and on the related web site has been obtained from sources believed to be reliable, but its accuracy is not guaranteed. The security portfolios of writers for this issue may, in some instances, include securities mentioned herein and on the related web site. Estimates, assumptions and other forward-looking information are subject to the limits of forecasting. Actual future developments may differ materially due to many factors. No one associated herewith receives compensation in any manner from any of the companies that are discussed in this newsletter or on the related websites.
This is a commerical email. It may contain advertisment or solicitation. This email was sent to ~~EMAIL~~. Please click the following link to change or unsubscribe. All Rights Reserved. 300 New Jersey Ave, Suite #500, Washington, DC 20001 |
NOTE: You have ~~VIP~~ VIP Points!
* Each VIP Point is worth $1 off the price of any of our monthly subscription newsletters!
|
|

THE WEEKEND ISSUE |
| Informing Investors Around The World |
| Read In All 50 States And Over 100 Countries |
| You have earned ~~VIP~~ points worth $~~VIP~~ Click here for details* |
Weekend Newsletter for
September 8, 2019
Table Of Contents
1) MARKET SUMMARY from THE DAILY
2) IH ALERTS
3) SUCCESS TRADING GROUP
4) COVERED CALL SERVICE
|
 |
|
1) MARKET SUMMARY:
Excerpted from Thursday's paid content of "The Daily" by Jon Johnson at InvestmentHouse.com. To get his latest information and his daily content, click here now to receive a two-week trial and save $30/month. (You won't find this offer on the Investment House website. It is exclusively for The Weekender subscribers!)
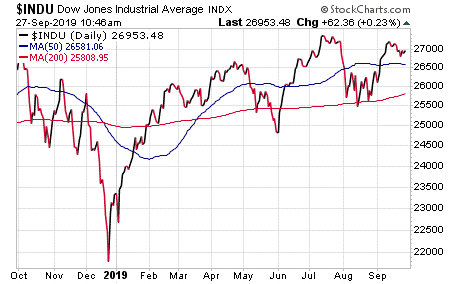
Some Respite From the Trade War.
- With the selling blunted by some quantitative easing (QE) and who knows what else, the market was primed and the trade news was the trigger.
- The S&P500, DJ30 and the NASDAQ have cleared the range.
- The Chinese government said that the U.S. should be ready for a "meaningful" breakthrough in October.
- Productivity shows good gains.
- The Wall Street Journal says that there will just be a 25 basis-point cut in September.
- That is, Fed Chairman Jerome Powell has rescued the market with rate cuts and QE. He will then cut another 25 basis points later this month and will consider his work done. Meanwhile, we are looking for some tests off of this move to give us some entrance and exit points.
|
Market Summary (continued from above)
An agreement to meet to discuss the trade war in October -- one that Chinese insiders who are "in the know"
said could lead to a "breakthrough" -- led to a breakthrough of its own in the stock market.
The Fed should print up a "Mission Accomplished" banner. When the rate cuts did not stop the selling, or at least did not bounce the market back up,
the Fed was impelled to buy bonds again. That, along with the fact that buyers were able to blunt each selling attempt,
poured water over the selling. That set the stage for a favorable headline or two that
could then work to break stocks higher. On Tuesday, we saw the resilience of financial stocks. On Wednesday, the chips showed resilience and on Thursday, that favorable headline appeared.
The market was set to break higher and the headline triggered it.
This situation made it difficult to get into positions, but it did push current positions
such as Twitter (TWTR) and Nvidia (NVDA) higher. Moreover, a lot of stocks jumped higher and then either reversed
the moves or fell well off the highs. Some examples include Match Group Inc. (MTCH), Texas Instruments Incorporated (TXN), Reliance Steel & Aluminum Co. (RS), The Coca-Cola Co (KO), JinkoSolar Holding Co., Ltd. (JKS), Electronic Arts Inc. (EA) and Applied Materials, Inc. (AMAT). Others did
hold moves as they gapped and rallied, e.g. Google (GOOG), Amazon (AMZN), Facebook (FB), Urban Outfitters, Inc. (URBN) and Five Below Inc. (FIVE). While we were able to
get into some of these plays, we will have to wait for a test off of this good move.
S&P500, SOX and the DJ30: All gapped over the prior resistance. While the DJ30 and the PHLX Semiconductor Sector Index (SOX) faded off
the highs, there was nothing major in terms of the overall move. Basically, they moved strongly up to the
next resistance and then backed off just a bit. Meanwhile, both the S&P500 and SOX bumped the bottom of the
July range and stopped.
NASDAQ: Gapped over the 50-day simple moving average (SMA), tapped the bottom of the July range (which was a
new high) and stopped for the day. After some more upside on the jobs report, the NASDAQ may start to test the breakout over resistance.
NOTE: The figures and information above are from the 9/5 report.
Watch Market Overview Video
Watch Technical Summary Video
Watch Next Session Video
NOTE: The videos are from the 9/5 report.
Here are two trades from "The Daily," offering insights into our trading strategy and the targets that we have hit this week:
AMZN (NASDAQ: Amazon.com, Inc.)
Company Profile
It’s been four weeks at the 200-day SMA for AMZN, which mimics the indices’
range. For each test of the 200-day moving average (MA), AMZN has held well, particularly late August.
It then tested when the markets opened on Tuesday and then rebounded and gapped upside on Wednesday to the 20-day exponential moving average (EMA). If the S&P500 breaks
out, AMZN will be there. If so, we are ready to move in for a run at the 50-day SMA. That
move will give us a gain of around 55% on the call options.
FIVE (NYSE: Five Below)
Company Profile
Retail remains one of the hotter areas in the market and FIVE is setting up for
an entry. FIVE gapped higher on Thursday, gapping over the 200-day MA on big volume and
broke higher on a solid earnings report.
On Friday, FIVE tested back as the market was softer overall and coming back toward the 200-day SMA on lighter trade. Likely, FIVE will come
back to test the 200-day SMA and then make its move back upside to continue the
breakout.
We have to be ready, however, if FIVE just decides to move higher from here. A continued rally to the initial target will give us
a 10% gain on the stock and a 65% gain on the call options.
Targets Hit This Week:
Procter & Gamble Co. (NYSE:PG): When we put PG on the report we received emails that used words like "boring," "stodgy" and "old economy." The fact that no one said "not sexy" may be a sign of the times -- not that PG is sexy. Anyways, I learned a long time ago a pattern is a pattern is a pattern, regardless of the stock. When you add on the market volatility at the time and that other groups were selling at a time that PG was steadily rising, all of these facts said what needed to be said regarding the play. On 8/7, we saw PG come off the 50-day EMA in a routine test. After we put it on the report, PG moved higher again during the next session. That triggered our entry and we bought some October $115.00 calls for $5.10.
Why did we only buy options? At $115 and since PG is admittedly not a stock that explodes with 20% gains, the options were a great way to get in and leverage our money. PG proceeded to perform as expected: a rise, a test of the 20-day EMA, a rise and a test of the 20-day EMA. This pattern then repeated itself again and again. On 9/4, PG hit our target. However, it was moving so well that we left it on. During the next day, PG started higher again . . . and then lost its bid. It was time to sell. We sold the options for $8.95 and banked the 75% gain. Yes, it was rather boring, but boring when things go as planned is the good kind of boring.
Iconix Brand Group (NASDAQ:ICON): This one was unusual for us in a way as it trades with a relatively low average daily volume (around 200K). However, we have played it before and the pattern was one we like. This was because the stock was coming off a long decline and the indicators were slowly turning positive. Then, they showed a meaningful break. ICON experienced that pattern with a move higher in August to the 200-day SMA and then a week-plus lateral move just below that resistance. We put it on the report on 8/20 and waited for the break higher. On 8/26, ICON broke higher on some volume and we picked up the stock for $1.68. A quick test during the next two sessions gave up virtually no ground and ICON resumed the upside. The stock marched higher going into Wednesday and then started to struggle near our initial target. As a result, we banked part of the stock for $1.98 and a 17.8% gain. ICON continued to rise on Thursday, touching $2.10 on the high and a solid 22% gain.
Receive a two week trial and if you stay on receive a $30 per month discount!
|
2) IH ALERTS
NYSE:KEYS (Keysight Technologies--$94.29; -2.56; optionable): Software
Company Profile
EARNINGS: 11/20/2019
STATUS: Pennant. KEYS gapped higher on 8/22 out of a four-month base. It then experienced a nice break higher and worked laterally while waiting for the 10-day EMA to catch
up. On Tuesday, KEYS tapped the 10-day EMA, rebounded decently off the low and held the
gap point above the highs in the prior base. As the stock has held up well in a weaker market,
when KEYS makes a new break higher through the buy point, we will move in. A rally to the
target will give us a gain of 8% on the stock and a gain of 70% on the options.
VOLUME: 1.103M Avg Volume: 1.689M
BUY POINT: $97.44 Volume=2.5M Target=$105.94 Stop=$94.71
POSITION: KEYS NOV 15 2019 95.00c -- (50 delta) &/or Stock
CHART IMAGE
Save $600 per year and enjoy a two week trial of our IH Alerts Service!
|
3) SUCCESS TRADING GROUP
-- by the MarketFN STG Team
NYSE:JKS (JinkoSolar Holding Co. Ltd.)
Company Profile
Our Success Trading Group members scored another winning trade when we closed out a position in JinkoSolar Holding Co. Ltd. (NYSE:JKS). We are watching several other stocks and are looking forward to trading next week.
Our Success Trading Group closed seven years with zero losses on our Main Trade Table. In fact, we closed 100% winning trades for the calendar years 2016, 2015, 2013, 2012, 2011, 2010 and 2009. We still have one open position from 2017 (all others were winners) and one trade that we opened in 2014 but was closed as a losing trade.
All of these trades are posted on our Main Trade Table for your review during your free membership trial period.
Get Our Next Trade Free - Save $50 per month! Details Here.
|
4) COVERED CALL PLAY
NASDAQ:CDMO -- Avid Bioservices is currently trading at $7.05. The October 19 $7.50 Calls (CDMO20191019C00007500) are trading at $0.60. That provides a return of about 9% if CDMO is above $7.50 by the time of the expiration.
Company Profile
Learn more about our Covered Call Tables |
| PREMIUM SERVICES |
The foregoing is commentary for informational purposes only. All statements and expressions are the opinions of Online Investment Services, LP., or Split Ventures, Ltd. This information is not meant to be a solicitation or recommendation to buy, sell, or hold securities. We are not licensed or registered in the securities industry. The information presented herein and on the related web site has been obtained from sources believed to be reliable, but its accuracy is not guaranteed. The security portfolios of writers for this issue may, in some instances, include securities mentioned herein and on the related web site. Estimates, assumptions and other forward-looking information are subject to the limits of forecasting. Actual future developments may differ materially due to many factors. No one associated herewith receives compensation in any manner from any of the companies that are discussed in this newsletter or on the related websites.
This is a commerical email. It may contain advertisment or solicitation. This email was sent to ~~EMAIL~~. Please click the following link to change or unsubscribe. All Rights Reserved. 300 New Jersey Ave, Suite #500, Washington, DC 20001 |
NOTE: You have ~~VIP~~ VIP Points!
* Each VIP Point is worth $1 off the price of any of our monthly subscription newsletters!
|
|
By: Jon Johnson, Editor
Copyright 2015 | All Rights Reserved Jon Johnson is the Editor of The Daily at InvestmentHouse.com Technorati tags: stock trading stock market investing Jon Johnson InvestmentHouse.com

THE WEEKEND ISSUE |
| Informing Investors Around The World |
| Read In All 50 States And Over 100 Countries |
| You have earned ~~VIP~~ points worth $~~VIP~~ Click here for details* |
Weekend Newsletter for
September 1, 2019
Table Of Contents
1) MARKET SUMMARY from THE DAILY
2) IH ALERTS
3) SUCCESS TRADING GROUP
4) COVERED CALL SERVICE
|
 |
|
1) MARKET SUMMARY:
Excerpted from Thursday's paid content of "The Daily" by Jon Johnson at InvestmentHouse.com. To get his latest information and his daily content, click here now to receive a two-week trial and save $30/month. (You won't find this offer on the Investment House website. It is exclusively for The Weekender subscribers!)
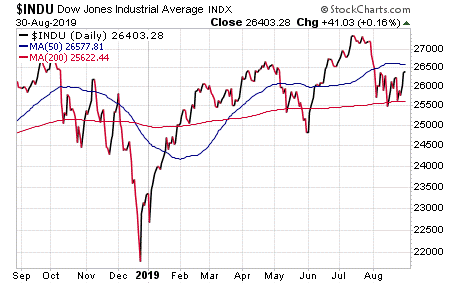
The Trade Dispute With China Continues.
- Indices remained at the bottom of the range before China took the "calm" route. Then, the stocks jumped.
- Volume finally rose on an upside session, but overall, the downside trade is still stronger.
- Gross Domestic Product (GDP), as expected, had rising consumption and so-so business investment.
- We saw more commentary that the yield curve means nothing, but this is easy to say on days when the market rallies.
- Last Thursday, the indices touched the high end of the range and then were torched. With the hurricane approaching Florida, the indices may get a pass this time.
- Will the China-blinkmomentum propel stocks to the top of the range or out of it? Personally, I would love to have a trend again.
|
Market Summary (continued from above)
On Wednesday, we mused about the up one day, down the next pattern in the market and
questioned whether it could continue on Thursday with a downside session. There were some
very good upside patterns after that Wednesday gain with some areas (such as machinery/manufacturing and some financials) that had been really beaten down
starting to show some double bottoms. We
also talked about the headline-driven action in the market. We are always just one headline away -- up or down -- from the
market breaking in the direction favorable to the headline.
On Thursday, it appeared that it was China’s turn to blink as the Chinese commerce ministry
spokesman, at his regular press meeting, stated, with a "calm attitude," that China was willing to work on trade with the
United States and that the two sides are in “effective contact” right
now. He noted that while China “has options” if it chooses to retaliate, he feels it is best to
discuss the U.S. choosing to remove the new tariffs as the first course of business.
Thus, after President Trump’s blink in delaying some of the tariffs, China blinked unannounced.
This makes one wonder if the two leaders are dancing
through a kind of choreographed two-step. Nah.
S&P 500: It gapped and rallied to close over the 50-day moving average (MA). Now, the S&P 500 is approaching the top
of the past three weeks. This is the third bounce higher off the initial low versus two sell-offs.
Once again, we will have to see if the upside has the strength to make the move.
NASDAQ: It gapped higher, rallied through the 50-day exponential moving average (EMA) but then faded to
close at that level. Even so, it is still considerably below the top of the range and still has room to test higher.
Meanwhile, its volume is up and is roughly matching the downside volume from Tuesday.
DJ30: It gapped and then rallied to close over the 50-day EMA. While it currently lies below the top of the
range, about 70 points, this is nothing in light of the Thursday surge.
NOTE: The figures and information above are from the 8/29 report.
Watch Market Overview Video
Watch Technical Summary Video
Watch Next Session Video
NOTE: The videos are from the 8/29 report.
Here are two trades from "The Daily," offering insights into our trading strategy and the targets that we have hit this week:
NVDA (NASDAQ: Nvidia Corporation)
Company Profile
Triangle. We have talked about NVDA’s nine-month triangle that has formed a double bottom with a handle over the the last five to six weeks. Over the past week, the handle formed over the merging
50-day and 200-day MA. It then saw a tight doji on Wednesday at the 200-day simple moving average (SMA) on light trading and then faded from the upper trendline over the past week on mostly lower trading.
Always watch for these higher lows at key levels inside these patterns as they often presage a breakout
move. Accordingly, watching for a strong break higher. This is a great pattern, and if NVDA
makes a break upside, it would be a good risk/reward for a move from the May gap. That move
would give us a gain of around 10% on the stock and a gain of around 90% on the options.
WMT (NYSE: Walmart)
Company Profile
Double bottom w/handle. After a breakout in early June and rally to mid-July, WMT has formed the current double bottom.
It then gapped upside through the 50-day MA on earnings, spent the last week testing and then moved back to the 50-day EMA. It tested that level on last Friday's low and bounced on the following Monday.
If WMT continues, we want to play a move back to the prior high as the initial target. That move would give us a gain of around 55% on the options.
Targets Hit This Week:
Chipotle Mexican Grill (NYSE:CMG): In late July, CMG gapped higher from a seven week flat trading range and rallied to the end of the month. This was a good move, even though we did not chase this gap as we knew that we would get another chance at entering. To start August, CMG tested that move and came back to the 20-day EMA -- after a late July test of the 50-day MA before that gap higher. This makes a good test and new run. Anyways, the fact that it tested the 20-day EMA had us ready to play the upside as CMG started a new leg. On 8/7, it made the bounce off the 20-day EMA and we bought September $795.00 calls for $34.80. CMG gapped higher during the next session and then rallied more on top of that on 8/9. During that session, the large cap indices hit the top of the range and started to fade. We then decided to sell part of the position since the options were priced at $47.00 and banked a gain of 35%.
We held the rest to see if CMG could maintain its trend. Indeed, CMG came back to test the 20-day EMA moving average for a session, started back upside and became a really strong stock as it ignored the market and showed the usual rise and fade, rise and fade over the 10 and 20-day EMA in a good uptrend. On Tuesday, CMG gapped higher and hit our initial target. We sold some more options for $58.80 and banked a gain of 63%.
Coupa Software Inc. (NASDAQ:COUP): COUP is one of the cloud software stocks we started playing back when its price was in the thirties and its daily average volume had it under most people’s radar. The patterns kept setting up over and over, and it would break higher again and again. Eventually, the average volume of this stock grew as its name caught on. We just kept playing it.
This last play involved a 50-day EMA test. That is, COUP had rallied from April off a significant test of the 50-day MA, moved up the 20-day EMA with four touches. After that, we started looking for a new 50-day MA test. Sure enough, the begining of August saw COUP give us what we wanted and we put it on the report for the next rally. On 8/8, COUP broke higher off the 50-day MA after a bounce and a quick intraday test two sessions later. Since this was a good signal, we moved in with some September $135.00 strike call options for $11.10. Well, COUP wanted another test and faded into 8/14 with another 50-day MA test. It even undercut that support during that day, and importantly, held it when the market closed. Thus, we had to see if that support would hold before we would act. It did, so we held the position. COUP rallied into Tuesday (8/27), touching our initial target at the prior highs. As the options were selling for $16.80, we were able to sell for $16.90 and bank a gain of 52%.
Receive a two week trial and if you stay on receive a $30 per month discount!
|
2) IH ALERTS
NASDAQ:CHUY (Chuy's Holdings--$24.35; +0.21; optionable): Restaurants
Company Profile
EARNINGS: 11/07/2019
STATUS: Pennant. A nice gap breakout during the first week of August cleared several recovering
highs and the early November downside gap. It is always an important move when a stock
clears the interim recovery highs in a base. Indeed, this one started off the July 2018 high.
Looking back, it was a classic four downside gap move that reversed after the last gap. Now,
after seven months of forming the base after that low, CHUY made a strong move higher and was ready to form the right side of the base. It then came back to fill the early August gap higher and sat at the 20-day EMA and on top of the interim highs. We then waited for a new break
higher to move in with an initial target at the early August high. That should be the start as there were other gaps to fill up. First things first: break higher and then move in. A rally to
the initial target would give us 10% on the stock and around 80% on the options.
VOLUME: 42.129K Avg Volume: 139.147K
BUY POINT: $24.94 Volume=200K Target=$27.45 Stop=$24.11
POSITION: CHUY OCT 18 2019 25.00C -- (45 delta) &/or Stock
CHART IMAGE
Save $600 per year and enjoy a two week trial of our IH Alerts Service!
|
3) SUCCESS TRADING GROUP
-- by the MarketFN STG Team
NYSE:PINS (Pinterest Inc.)
Company Profile
Our Success Trading Group members scored another winning trade when we closed out a position in Pinterest Inc. (NYSE:PINS). We are watching several other stocks and are looking forward to trading next week.
Our Success Trading Group closed seven years with zero losses on our Main Trade Table. In fact, we closed 100% winning trades for the calendar years 2016, 2015, 2013, 2012, 2011, 2010 and 2009. We still have one open position from 2017 (all others were winners) and one trade that we opened in 2014 but was closed as a losing trade.
All of these trades are posted on our Main Trade Table for your review during your free membership trial period.
Get Our Next Trade Free - Save $50 per month! Details Here.
|
4) COVERED CALL PLAY
NASDAQ:RDHL -- Redhill Biopharma Ltd. is currently trading at $7.52. The October 19 $7.50 Calls (RDHL20191019C00007500) are trading at $0.45. That provides a return of about 11% if RDHL is above $7.50 by the time of the expiration.
Company Profile
Learn more about our Covered Call Tables |
| PREMIUM SERVICES |
The foregoing is commentary for informational purposes only. All statements and expressions are the opinions of Online Investment Services, LP., or Split Ventures, Ltd. This information is not meant to be a solicitation or recommendation to buy, sell, or hold securities. We are not licensed or registered in the securities industry. The information presented herein and on the related web site has been obtained from sources believed to be reliable, but its accuracy is not guaranteed. The security portfolios of writers for this issue may, in some instances, include securities mentioned herein and on the related web site. Estimates, assumptions and other forward-looking information are subject to the limits of forecasting. Actual future developments may differ materially due to many factors. No one associated herewith receives compensation in any manner from any of the companies that are discussed in this newsletter or on the related websites.
This is a commerical email. It may contain advertisment or solicitation. This email was sent to ~~EMAIL~~. Please click the following link to change or unsubscribe. All Rights Reserved. 300 New Jersey Ave, Suite #500, Washington, DC 20001 |
NOTE: You have ~~VIP~~ VIP Points!
* Each VIP Point is worth $1 off the price of any of our monthly subscription newsletters!
|
|
|


