
| ||
1) MARKET SUMMARY: Excerpted from Thursday's paid content of "Investment House Daily" by Jon Johnson. Stocks Started Strongly, But Gave Up the Gains With a Disappointing Close
| ||
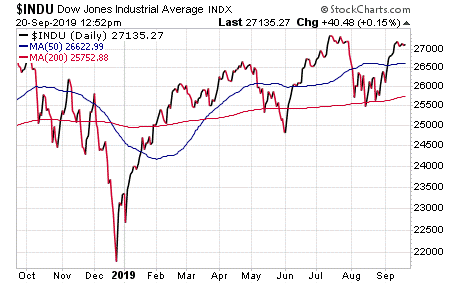
Market Summary (continued from above) This week, we had the Fed cutting rates and also ready to try quantitative easing (QE). We also had housing starts at a 12-year high, existing home sales reaching their strongest level since March 2018 and consumption all coming to a head this week. Again, it is hard to imagine what would undermine the Fed bid. What about the reposession (repo) market going crazy? It's possible. The Federal Open Market Committee (FOMC) is at risk of losing control of the short end of the yield curve, which is the end it controls. Trade was another issue. Indeed, trade was credited with a weakening market after midday on Thursday. This was when one of President Trump's close trade advisors opined that tariffs could go to 50% or even 100% if the United States needed to retaliate. Perhaps that was the problem, even though it seemed more as if he was throwing out ideas versus stating policy. In the end, the situation when the indices closed was mixed. This is not surprising as the large-cap indices were affected by Microsoft's (MSFT) gap higher and the gains that had occurred earlier in the session. S&P500: We saw a reach below the 10-day exponential moving average (EMA) and the 2019 trendline, followed by a reversal to a modest gain on a rising and above-average volume. This situation shows that buyers were moving in as the S&P500 rebounded off the lows and was back above the key near-term support. NASDAQ: There was a reach below the 10-day EMA that went down near the 50-day simple moving average (SMA) and then a rebound to a flat trajectory due to a rising average volume. Buyers came in on the lows and rallied the NASDAQ back up 89 points when the markets closed. NOTE: The figures and information above are from the 9/19 report. The discussion on the indexes is from the 9/18 report. Watch Market Overview Video Watch Technical Summary Video Watch Next Session Video NOTE: The videos are from the 9/18 report. Here are two completed trades from "The Daily," offering insights into our trading strategy and the targets that we have hit this week: Targets Hit This Week: TherapeuticsMD Inc. (NASDAQ:TXMD): We spotted TXMD in early September as one of the "turning the corner" plays. These are plays where the stock has trended lower for quite some time and then made its turn to break the downtrend. It broke over the 50-day MAs and tested into early September by coming back to those 50-day MAs as support. We put it on the report and started to look for the break higher to signal our entry. Piece of cake, right? Well, this one was. TXMD broke sharply higher on 9/9. We entered this play, which was a stock play due to the stock price, at $3.09. From there, it was pretty much a straight upside to 9/17 and a rendezvous with the 200-day SMA. Then, TXMD hit the 200-day, stalled and showed a doji. Since it was time to bank the gain, we sold the position for $3.80 and banked a 22% gain. SM Energy Co. (NYSE:SM): This trade was a bit bumpier. Oil stocks were rising already and the attack on the Saudi production facility enhanced our interest. We moved in when SM's shares broke higher over the 50-day EMA on 9/9. We bought the stock for $11.07 and the November $10.00 calls for $2.05. We chose the November calls because we wanted to ride this one into its October earnings announcement. Well, that wasn’t the case because SM rallied during the next session. Then, it faded and faded again. SM then sold to the 50-day SMA as of 9/8 and we were ready to close it if it could not bounce. On 9/16, it bounced quite well. SM gapped upside and ran over $12.80 on the high. Then it stalled. After we did a quick assessment of the oil sector and saw most moves stalling, we quickly decided to close the position. We then sold the stock for $12.62 and banked a 14% gain. Concurrently, we sold the November calls for $3.10 and banked a 51% gain. While we are no longer riding it through to its earnings, this was a decent gain under the current market conditions. As it turns out, SM flopped Tuesday and made our decision to take profits even better. Receive a two week trial and if you stay on receive a $30 per month discount! | ||
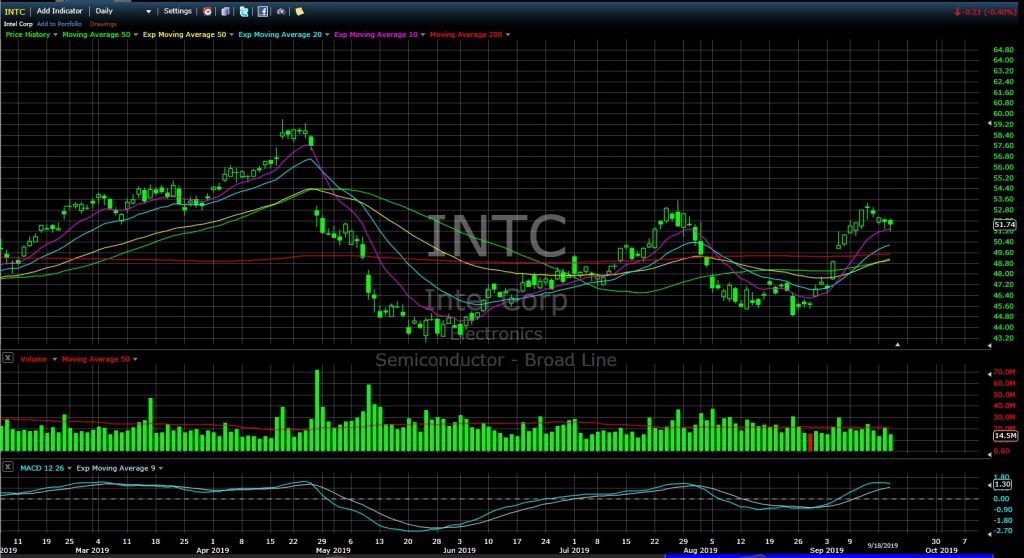
2) IH ALERTS NASDAQ:INTC (Intel -- $51.74; -0.21; optionable) Company Profile EARNINGS: 10/24/2019 STATUS: This was a familiar pattern as it took the form of a short eight-week cup with a handle that is part of a larger base that formed after INTC peaked in late April. Last week, INTC rallied back up to the late July highs that it hit just before this cup base started. After a doji last Thursday, INTC faded to the 10-day EMA, tested it throughout Tuesday and Wednesday and bounced up from it when the markets closed on Wednesday. Thus, we believe that the stock will be ready if not already primed. We want to play the break back upside when it posts a strong move through the entry point and stays there. A rally to the target at the April upside gap point will give us a solid 95% gain on the options. VOLUME: 15.03M Avg Volume: 22.392M BUY POINT: $52.22 Volume=25M Target=$56.54 Stop=$50.79 POSITION: INTC NOV 15 2019 52.50C -- (48 delta) &/or Stock CHART IMAGE Save $600 per year and enjoy a two week trial of our IH Alerts Service! | ||
3) SUCCESS TRADING GROUP -- by the MarketFN STG Team NYSE:SM (SM Energy Co.) Company Profile Our Success Trading Group members scored another winning trade when we closed out a position in SM Energy Co. (NYSE: SM). We are watching several other stocks and are looking forward to trading next week. Our Success Trading Group closed seven years with zero losses on our Main Trade Table. In fact, we closed 100% winning trades for the calendar years 2016, 2015, 2013, 2012, 2011, 2010 and 2009. We still have one open position from 2017 (all others were winners) and one trade that we opened in 2014 but was closed as a losing trade. All of these trades are posted on our Main Trade Table for your review during your free membership trial period. Get Our Next Trade Free - Save $50 per month! Details Here. | ||
4) COVERED CALL PLAY Adma Biologics Inc. (NASDAQ:ADMA) -- Adma Biologics Inc. is currently trading at $5.25. The November 16 $5.00 Calls (ADMA20191116C00005000) are trading at $0.75. That provides a return of about 16% if ADMA is above $5.00 by the expiration. Company Profile Learn more about our Covered Call Tables | ||
| ||
The foregoing is commentary for informational purposes only. All statements and expressions are the opinions of Online Investment Services, LP., or Split Ventures, Ltd. This information is not meant to be a solicitation or recommendation to buy, sell, or hold securities. We are not licensed or registered in the securities industry. The information presented herein and on the related web site has been obtained from sources believed to be reliable, but its accuracy is not guaranteed. The security portfolios of writers for this issue may, in some instances, include securities mentioned herein and on the related web site. Estimates, assumptions and other forward-looking information are subject to the limits of forecasting. Actual future developments may differ materially due to many factors. No one associated herewith receives compensation in any manner from any of the companies that are discussed in this newsletter or on the related websites. This is a commerical email. It may contain advertisment or solicitation. This email was sent to ~~EMAIL~~. Please click the following link to change or unsubscribe. All Rights Reserved. 300 New Jersey Ave, Suite #500, Washington, DC 20001 | ||
|


No comments:
Post a Comment