Tuesday, December 31, 2019
Monday, December 16, 2019
Monday, December 09, 2019
Monday, December 02, 2019
Weekender 12/1
1. Market Summary
Upside Break Continues
– Tuesday continued the upside break even though it was a bit hungover and the PHLX Semiconductor Sector (SOX) was down.
– The Fed and trade have pushed the upside.
– The gains of housing prices are slowing.
– There was a data dump on Wednesday.
While Tuesday was not the blowout session that Monday was, it was no slacker. At least, it was not much of one. The S&P 400 mid-caps led with a solid 0.41% move, but SOX was negative and the other indices were less than impressive. All the same, they advanced on top of Monday’s new break higher, which showed breadth and volume in addition to new highs.
More trade and Fed positives, or at least a lack of negatives, allowed the bids to continue. Really, there is no reason to pull them with the news flow that is still being underwritten by the Federal Reserve's decision to stop rate hikes and restart its liquidity pump.
Several housing-related reports were issued on Tuesday. Some were okay, some were not. The Case/Schiller Index indicated that prices rose in September. The Federal Housing Finance Agency (FHFA) housing report for the same month showed that prices rose 0.6% vs. 0.2% in the prior month. While the figures are positive overall, there are issues.
Technical Analysis:
The large-cap indices all edged higher.
The S&P 400 mid-caps were quite decent and the index's 0.41% gain extended the breakout from the trading range.
SOX was disappointing. After a solid upside break on Monday, it experienced a bit of a stall. It then held the 10-day exponential moving average (EMA) on the close. This was neither death nor a huge negative, but it did lag the market. SOX will need to take the lead again.
NOTE: The figures and information above are from the 11/26 report. There are no videos this week due to the Thanksgiving holiday.
2. Targets Hit
Here is one completed trade from Investment House Daily, offering insights into our trading strategy and the target that we have hit this week:
Hilton Hotels Corporation Common Stock (NYSE:HLT):The hotel stocks set up some nice patterns from mid-summer to autumn. HLT, for instance, formed a nice cup with a handle base. After this excellent handle setup to start November, we saw it tap the 20-day EMA with a doji. Then, we put it on the report.
On Nov. 14, HLT jumped off the 20-day moving average (MA) on great volume. We moved in with January $100.00 call options at $2.95 when the stock was at $101.29. HLT jumped higher and tested the 20-day EMA into Nov. 21. On Friday, HLT surged and continued doing so into Monday and Tuesday. Then, it hit our initial target. We sold half the options for $5.40 and banked an 83% gain.
Since the stock rallied further, the options began to be bid at $6.60. This is a 120% increase in value. We will let the remaining half work as long as HLT puts in this kind of move. When it slows or gaps higher and starts to fade, we will bank the rest of our gains.
Receive a risk-free trial to Investment House Daily and save 50% by clicking here now!
Here is one completed trade from Technical Traders Alert, offering insights into our trading strategy and the target that we have hit this week:
Clovis Oncology Inc. (NASDAQ: CLVS): We already had banked some nice gains on CLVS on Nov. 20. We had picked up the stock for $6.27 on Nov. 14 and January $6.00 call options for $1.45. After CLVS's little test, it just kept on running higher into Thursday, Friday, Monday and Tuesday. However, CLVS surged and then started to stall on Tuesday. This was a huge move with nice gains.
Last week, we talked about how the options in low-priced stocks were not always commensurate with their moves in value as options in the higher priced stocks are. As a result, it would take a really big gain for us to get interested in buying options in low-priced stocks. Well, this time we got it.
As CLVS surged into Tuesday, we sold the rest of the stock for $9.97 and a 59% gain. We sold the remaining call options for $4.10 and banked a 180% gain. That is the kind of move it takes to pump up the options of lower-priced stocks. That said, this strategy was really sweet.
Receive a risk-free trial to Technical Trader and save 50% by clicking here now!
Here is one completed trade from the Success Trading Group, offering insights into our trading strategy and the target that we have hit this week:
NYSE:SNAP (Snap, Inc.)
After SNAP peaked in late July and sold back, we kept an eye on it. We played it on the move up in late September. When it tumbled into October, we were still watching. It then double-bottomed off the 200-day SMA for the second time in the second half of November. When it broke over the 50-day MAs, that was the move we were looking for. On Nov. 20, SNAP continued on its trajectory and we picked up the stock for $15.33. SNAP then worked a bit higher and moved laterally.
On Monday, it gapped higher with the rest of the market. That took SNAP to our initial target. When we saw it start to stall, we took the gains. That is, we sold the stock for $15.83 and banked a gain of 3.26%.
This is an example of what you'll get by becoming a member of Success Trading Group. The system is geared towards bringing you consistent, short-term gains of 5-10% and you can expect four to six trades every month.
To receive a risk-free trial and save 50%, click here now!
3. Pick of the Week
MSFT (Microsoft--$151.23; +1.63; optionable)
EARNINGS: 01/22/2020
STATUS: Flag. We are looking at a new position to add on to MSFT as it completed a three-session test of the 10-day EMA and then broke higher on a solid rise in volume on Monday. There is nothing fancy here. We are just looking to play a logical move for MSFT as it continues to climb higher. A move to the target will give us a gain of around 60% on the options.
VOLUME: 22.429M Avg Volume: 22.214M
BUY POINT: $151.38 Volume=23M Target=$156.49 Stop=$149.71
POSITION: MSFT JAN 17 2020 150.00C -- (59 delta)
To see the MSFT chart image, click here!
To receive all of Jon's picks in Investment House Daily, click here now to start your risk-free trial and save 50%!
4. Covered Call Options Play
Cara Therapeutics Inc. (NASDAQ:CARA) -- Cara Therapeutics Inc. is currently trading at $24.55. The Jan. 18 $22.50 Calls (CARA20200118C00022500) are trading at $4.30. That provides a return of about 18% if CARA is above $22.50 by the expiration.
Learn more about our Covered Call Tables here!
Tuesday, November 26, 2019
Weekender 11/24
1. Market Summary
Trade Issues Move the Market Back and Forth
– Absurdly varied trade headlines are fortunately having less impact than before.
– Indices are testing, but they are not testing much. Is this all the test that they can give?
– Leaders are already testing 5% or more.
– If the leaders start moving back up, the rally to the year's end will likely do the same.
Each day always seems to feature more back and forth trade stories. The number of conflicting headlines that come out each day has reached the point of absurdity. It is also unbelievable that some of the "news" is stale by a week or more and yet it still sends the markets up or down as investors trade the headlines. While this is ludicrous, the market has immunized itself from this pathology somewhat as the headlines are now moving the indices less and less. Still, the news does move them.
As noted, there are leaders in pullbacks. When they move higher, the market's year-end run will likely resume as well. Thus, we are watching Google (GOOG), Nvidia (NVDA), Broadcom (AVGO), Advanced Micro Devices (AMD), Microsoft (MSFT), Cummins Inc. (CMI) and others for new moves higher. While Friday is not a favorite buying day, the prior four Fridays have had upside moves.
Of course, that does not necessarily make them good buying sessions even though they can feature good profit-taking if the profits are there. Last Friday, for instance, we banked quite a bit of profit before the market tested during the following week. Before this, the market had consolidated laterally after a rally on the previous Friday. It would appear that the old adage of "buy on Monday, sell on Friday" still works.
Technical Analysis:
It certainly appears that a test is on. While it may not be much of a test if you are looking for a sharp drop, it may be all that this particular market can give. Ever since early October, every dip has been bought even though the dips were typically just lateral moves. Indeed, all three "tests" have followed this trajectory.
The current pullback is actually showing a price fade, but the 10-day exponential moving average (EMA), the nearest possible support, is holding thus far. On both Wednesday and Thursday, the large-cap indices traded below the 10-day EMA, before recovering and holding on until the market closed. With the Fed providing liquidity on top of the seasonal trends, the November pullback may not be much of a pullback.
NOTE: The figures and information above are from the 11/21 report.
Watch the Investment House Video For This Week Here!
NOTE: The videos are from the 11/20 report.
2. Targets Hit
Here are three completed trades from the Investment House Daily, offering insights into our trading strategy and the targets that we have hit this week:
Advanced Micro Devices, Inc. (NASDAQ:AMD): AMD broke higher in late October and cleared a four-month base. It then consolidated in a flag or handle for a week. We were ready to pick it up as it moved up from the consolidation, and on Nov. 13, we entered with some stock at $37.05 and some January $35.00 call options for $3.75. As with many of the market leaders in tech, AMD marched right up and put in six consecutive upside sessions.
On Nov. 19, it hit our initial target. We banked half the stock for $41.43 and booked a gain of 11.8%. We also sold half the options for $7.50 and scored a gain of 100%. AMD then tested to the 10-day EMA from Wednesday to Friday and it looks as if it will bounce again. If so, it will add value to our current position and give us a new entry point.
Microsoft Corporation (NASDAQ:MSFT): MSFT broke out from a trading range with a gap on its earnings in late October. It then consolidated for over a week in a very tight range. When the 10-day EMA caught up with the move, it sent MSFT on the next leg of its journey. We love playing off these breakout consolidations, and when the 10-day EMA caught up, we were ready to enter.
As MSFT soon broke higher, we picked up the January $145.00 call options for $4.85. After that initial surge on Nov. 8, MSFT put in smaller, yet steady, moves. This is often the case with these breakouts. MSFT rallied for five straight sessions and hit our initial target on Nov. 15.
We then sold half the options for $7.50 and banked a gain of 55%. The stock tested the 10-day EMA through Thursday and started back upward Friday in what looks to be its next move. This would not be a bad point to enter once again.
Netflix Inc. (NASDAQ:NFLX): NFLX has been pretty much scorned since its gap lower in July. Indeed, it sold lower and lower into late September. Then, it reversed its sharp selling with a gap upside in conjunction with a higher moving average convergence divergence (MACD). It then built its base off of the low. Even in the shadow of Disney's launch of its own streaming service, NFLX's shares were improving.
We moved in on Nov. 11 as NFLX broke higher on the very day that Disney+ launched. We then bought January $295.00 call options at $18.55 when the stock was at $294.31. Disney+'s launch went well and NFLX dropped to the 50-day simple moving average (SMA) over the next two sessions. It held there over the next six sessions.
Then, NFLX rallied to a higher recovery high and it came within a point of our target on the strong Thursday close. We were ready to bank some gains, but NFLX opened lower on Friday. With that, we went ahead and sold our options for $27.00 and banked a solid 45% gain.
Receive a risk-free trial to Investment House Daily and save 50% by clicking here now!
Here are two completed trades from Technical Traders Alert, offering insights into our trading strategy and the targets that we have hit this week:
Clovis Oncology Inc. (NASDAQ:CLVS): Not all great money makers are the big names that are out in front. We like to keep track of various sectors to see if any are setting up to rally after downtrends or "turning the corner," as we like to say. Some biotech stocks, such as CLVS, fit this category. We saw CLVS break upside through the 50-day moving average (MA) on big volume on Nov. 8 and then test for two sessions.
After we put it on the report, CLVS broke higher again on Nov. 13. We then entered by buying stock for $6.27 and some January $6.00 call options for $1.45. Typically, we do not trade options on such low price stocks as they usually do not return the same bang for the buck as they do on higher priced stocks. The deltas may be the same, but they just do not make the same returns.
Anyways, we were in and CLVS was, in fact, turning the corner. It marched higher into Tuesday and then started to fade off of the high. During the next session, it opened lower, rallied to the prior open and then stalled. We then decided to sell part of the position.
As we sold half the stock for $7.69, we obtained a 22% gain. We also sold half the options for $1.90 and banked a 31% gain. This was not bad as, after a quick test, CLVS put in a higher recovery and added more value to the position. Indeed, the options were trading near a 70% return on Friday. It may work out better for us this time, but with the stock up 32% for us, a 70% option return is not what it would be if MSFT was up 32% -- the options would be near a 200% gain.
Euronet Worldwide, Inc. (NASDAQ:EEFT): We liked playing EEFT, and after it peaked in July, we looked for the next base to complete the trade. EEFT formed a downward pointing wedge into late October and then formed a sharp break higher out of the pattern through the 50-day and 200-day MAs to start November.
We let the stock test the break as we always like to see it test the break and hold. This shows us that there is no heavy selling, just profit taking. When the stock starts back up, we always move in. We put EEFT on the report on Nov. 11 and EEFT broke higher during the next session.
We entered with December $150.00 call options for $5.00. EEFT rallied right up to the target on Nov. 19 and we sold the options for $7.50. This gave us a gain of 50%. EEFT is now testing the move and we are looking at playing it once again as it breaks higher.
Receive a risk-free trial to Technical Traders Alert and save 50% by clicking here now!
Here is one completed trade from the Success Trading Group, offering insights into our trading strategy and the target that we have hit this week:
NYSE:HLT (Hilton Hotels Corporation Common Stock)
HLT is one of the hotel stocks that, as a group, set up some pretty nice bases over the past five months. For instance, HLT put in a double bottom and rallied off that second low in late October and early November. It then came back to test that move. As you now know, we love to play off that first test after a breakout. After we saw a doji at the 20-day EMA on Nov. 13, we put it on the report as we anticipated a bounce off that doji.
During the next session, HLT did just that and we entered at $98.89. Then, HLT ran right up to $100.82 and almost reached the target as of Nov. 19. No problem, the stock still looked strong. Then, it faded to test and tap the 20-day EMA again on Thursday.
On Friday, a good strong rebound took HLT right back up and we sold the stock for $101.29 and a 2.43% gain. Instead of being four days long, the holding period ended up being stretched to seven, but we will take whatever we can get.
These are examples of what you'll get by becoming a member of the Success Trading Group. The system is geared towards bringing you consistent, short-term gains of 5-10% and you can expect four to six trades every month.
To receive a risk-free trial and save 50%, click here now!
3. Pick of the Week
NASDAQ:ROKU (Roku, Inc.--$158.93; +5.02; optionable)
EARNINGS: 02/05/2020
STATUS: Triangle. Earnings gapped ROKU towards the downside. After that one-day gap, it rebounded straight back up into this week and we banked some gains on the recovery. On Tuesday, ROKU faded to test the 10-day EMA and showed a doji. On Wednesday, it was back upside and was still showing a solid and above average volume. That short test could be all ROKU gives. As it continues upside through the buy point, we want to move in for a run at the prior high. That move will give us a gain of 10% on the stock and a gain of 55% on the options.
VOLUME: 26.428M Avg Volume: 20.762M
BUY POINT: $160.15 Volume=25M Target=$176.43 Stop=$154.82
POSITION: ROKU JAN 17 2020 160.00C -- (54 delta)
To receive all of Jon's picks in Investment House Daily, click here now to start your risk-free trial and save 50%!
4. Covered Call Options Play
Boot Barn Holdings Inc. (NYSE: BOOT) -- Boot Barn Holdings Inc. is currently trading at $39.48. The Jan. 18 $40.00 Calls (BOOT20200118C00040000) are trading at $2.90. That provides a return of about 8% if BOOT is above $40 by the expiration.
Learn more about our Covered Call Tables here!
Monday, November 18, 2019
Weekender 11/17
1. Market Summary
Walking the Line
– Another soft open led to some bids, but no breaks higher.
– China is being childish on trade as it wants the tariffs removed before it agrees to anything.
– Prices remain relatively under control.
– Stock indices remain in their lateral consolidations. While some leaders broke higher, others tried to do so but were slapped back.
– We are still awaiting the breakout move.
Another day of the same type of action began when futures started lower and then moved higher to the close. This path was bumpy along the way and featured a big drop mid-morning. However, stocks caught a bid and recovered their losses during the last four-and-a-half hours of trading.
While the indices did move up off the lows, the recovery did not bring them positive gains. Those that made it into the green just barely reached into positive territory.
Gee, another session where stocks did not just surge to new highs or new closing highs (although the S&P 500 did put in that new closing high). What could be wrong? Find a scapegoat.
Chart Analysis:
S&P 500: It tested the 10-day exponential moving average (EMA) on the low during the second session and rebounded upside to a new closing high. Since the volume fell, not a lot was driving the move. Okay, maybe it wasn't a move. It was more of a bump higher.
NASDAQ: It also tested the 10-day EMA and then rebounded. While it did not achieve a new high, it was at the top of the range. While there has been some churn during the past two weeks, the NASDAQ still looks to be solid for now.
NOTE: The figures and information above are from the 11/14 report.
Watch the Investment House Videos For This Week Here!
NOTE: The videos are from the 11/13 report.
2. Targets Hit
Here are three completed trades from Investment House Daily, offering insights into our trading strategy and the targets that we have hit this week:
Cummins Inc. (NYSE:CMI): Industrials set up good patterns from August to September and were breaking higher. After we played CMI on its October run and scored a good gain, we kept watching CMI to test that move and set up a new run. In late October, CMI started testing the rally. It came back to the 20-day EMA and the gap from July. It soon found support there.
Then, it started to bounce and we put it on the report during the Nov. 3 weekend. On Nov. 4, CMI continued higher and we entered with January $180.00 call options for $6.60. As is often the case with these breakout tests, CMI wasted no time moving back up. It rallied each session up to near our target. It started to slow, however, and began working laterally.
On Nov. 12, CMI started higher but then started to fade at the same resistance. That indicated that this nice six-session bounce was running out of energy. We sold the options for $9.40 and banked a 42% gain.
Palo Alto Networks Inc. (NYSE:PANW): We saw a nice break higher to end October as PANW moved out of a short flag consolidation that formed right at the July high. After it broke that high, we saw a strong volume and believed that this was a great entry. So, we put it on the report.
During the next session, PANW continued higher. We bought the January $230.00 calls for $14.80. PANW immediately ... slid laterally for three sessions. Once the 10-day EMA caught up, however, PANW took off again. It rallied into Wednesday, where it hit the initial target and then backed off a bit. We then sold half of our options for $21.50 and banked a 45% gain. We will see if it can keep its momentum as it goes up to $250.
Teva Pharmaceutical Industries Ltd. (NYSE:TEVA): TEVA was one of those stocks that was coming out of a long downtrend, showing the signs it was "turning the corner" and indicating that it was ready to rally and make us gains. On Oct. 17, it broke up through the 50-day moving average (MA) on volume. After we put it on the report, it broke higher again with a surge on Oct. 21.
We entered by buying stock for $8.16 and some December $7.00 call options for $1.84. Normally, we like these plays because they can make us big percentage gains in a short period. Unfortunately, TEVA ... did not. After that Oct. 21 surge, it stumbled around for two weeks and slowly worked higher. It started November well, looked as if it was ready and then faded.
Finally, it caught a bid on Nov. 8 and the momentum carried it up to Wednesday, where it hit the target. We sold the stock for $9.40 (a 15% gain) and the options for $2.50 (a 35% gain).
Receive a risk-free trial to Investment House Daily and save 50% by clicking here now!
Here are three completed trades from the Success Trading Group, offering insights into our trading strategy and the targets that we have hit this week:
NASDAQ:AMD (Advanced Micro Devices, Inc.)
On Nov. 12, we saw AMD edge higher from a week-long consolidation of the breakout move that it had started in late October. After we got ready for the play, AMD broke higher from the consolidation on Nov. 13. We entered at $37.22. During the following session, AMD jumped higher early and then started to waffle. As a result, we sold our shares for $38.04 and banked a 2.2% gain. Although we left some shares on the table, AMD closed at $38.35. Oh well, we will play it again on the next test.
NASDAQ:INTC (Intel Corp.)
Similar to AMD, we saw INTC break higher from a week-long lateral consolidation (flag pattern) of its gap on Nov. 4. After that move, we bought INTC shares for $58.62. During the next session, INTC rallied higher. It looked great ... and then faded. After that, INTC plodded as it moved higher, faded, moved higher and faded again. Nonetheless, it moved higher. On Nov. 12, INTC jumped to a higher high and then started to struggle again. Okay. We sold our shares for $58.62 and banked a 2% gain. INTC has still been walking laterally since then. If it makes a new breakout, we aim to play it again.
NASDAQ:MSFT (Microsoft Corp.)
MSFT showed the same type of play -- the breakout gap and then a lateral consolidation. We love playing the move off the consolidation. On Nov. 8, MSFT broke higher and we moved in at $146.11 on Nov. 11. MSFT walked higher from there. On Nov. 15, it gapped higher, tested and then resumed the move. As it hit our target and started to falter, we sold our shares for $149.09 and banked a gain of just over 2%.
These are examples of what you'll get by becoming a member of Success Trading Group. The system is geared towards bringing you consistent, short-term gains of 5-10% and you can expect four to six trades every month.
To receive a risk-free trial and save 50%, click here now!
3. Pick of the Week
EEFT (Euronet Worldwide--$147.54; +0.96; optionable)
EARNINGS: 01/21/2020
STATUS: Downward wedge. We have been looking at EEFT again as it had set up a pattern in a way that was a bit better. It peaked in July and sold to and through the 200-day simple moving average (SMA) as of late October. The range narrowed as it sold and formed a downward pointing wedge.
In general, wedges tend to break in the opposite direction of the way that they are pointing. EEFT broke higher to start November and moved through the 200-day SMA. Since then, it slid laterally on low trading and has taken a breather. This stock is in a great position to move higher and looks very solid. A break upward that holds the move through the buy point will be the entry signal. A move to the initial target will give us a solid 70% gain on the options.
VOLUME: 255.408K Avg Volume: 423.315K
BUY POINT: $149.11 Volume=520K Target=$156.00 Stop=$146.78
POSITION: EEFT DEC 20 2019 150.00C -- (67 delta)
Watch the EEFT Analysis Video Here!
To receive all of Jon's picks in Technical Trader, click here now to start your risk-free trial and save 50%!
4. Covered Call Options Play
Sangamo Biosciences Inc. (NASDAQ:SGMO) -- Sangamo Biosciences Inc. is currently trading at $9.46. The Dec. 21 $9.00 Calls (SGMO20191221C00009000) are trading at $1.00. That provides a return of about 11% if SGMO is above $9.00 by the expiration.
Learn more about our Covered Call Tables here!
Monday, November 11, 2019
Weekender 11/10
1. Market Summary
Trade Issues Remain Salient
– Trade giveth, trade taketh away. Kind of.
– An early gap higher led to new highs on the S&P 500 and the DJ30. The NASDAQ slipped in the afternoon and gave up an earlier new high.
– We saw some more churn on the NASDAQ as all indices found some resistance -- outside the DJ30.
– Some leaders stalled, some did not. Others tried to become leaders.
We saw new highs on the large-cap indices again as positive trade headlines yet again provided a reason for investors to continue buying the rally. The rally was sparked by China's overnight announcement that the United States and China had agreed to cancel existing tariffs as part of signing the Phase 1 Agreement.
However, there was a question as to whether the United States would affirm the statement. Nonetheless, stocks started higher. Would the other shoe fall, i.e. would the Trump administration refute the tariff rollback? Later in the session, reports stated that the United States had confirmed China’s statements. Then, there was a great deal of rejoicing.
The good will hit a wall mid-afternoon as Reuters questioned whether the confirmation was really a confirmation. Stocks sold from mid-afternoon to the last hour before bouncing back somewhat at the end.
Chart Analysis:
S&P 500: It gapped out of the one-to-two day pullback and rallied to near 3100 before fading by 13 points. While the S&P 500 would end the day with a 8.40% gain, it lost most of the move during the session and showed a tombstone doji.
Should it move over? Not based on this. The S&P 500 broke higher on Monday, tested nicely and broke higher again on Thursday. While this is not a great finish on the session, it still saw a break higher and a new high.
NASDAQ: It gapped, rallied to a new high and then faded. While it did not reach a new high on the close, it held a nice gain nonetheless. Was there a peak? Yes, there was churn, given the higher volume and the third straight session of high stock turnover. This kind of churn suggests a pullback, but not a reversal.
NOTE: The figures and information above are from the 11/7 report.
Watch the Investment House Video For This Week Here!
NOTE: The video is from the 11/6 report. There was only one video this week.
2. Targets Hit
Here are three completed trades from Investment House Daily, offering insights into our trading strategy and the targets that we have hit this week:
Broadcom Inc. (NASDAQ:AVGO): AVGO moved back and forth as it tried to break out from a longer triangle in early September. However, it failed to do so. Over the next six weeks, however, it set up a short inverted head and shoulders pattern and put in a pattern consolidation. We liked the development and put it on the report on Oct. 31.
On Nov. 1, AVGO broke higher. As a result, we entered with some December $290.00 call options for $15.90. AVGO wasted no time on this breakout, gapping higher on Monday and rallying again on Tuesday. When it hit our buy point, we sold the options for $30.70 and banked a nice gain of 90%.
Nvidia Corp. (NASDAQ:NVDA): NVDA broke higher in mid-October. As we wanted to move in again, we were looking for an opportunity. It took just three days as NVDA put in a one-two-three test of that break and tapped the 10-day exponential moving average (EMA) on day three. After we put it on the report, NVDA broke higher on the following Monday.
Since that was the signal, we moved in with some December $195.00 calls that we bought for $12.90 when the stock was at $195.83. NVDA then put in a stair-step move up the 10-day EMA into this week and sported a strong upside break on Monday.
On Tuesday, it continued upside and then started to stall.
We opted to go ahead and bank half the gain by selling our calls for $21.55 for a solid 65% gain. We are still holding half the position in case NVDA can continue the run for us toward the year's end.
PVH Corp. (NYSE:PVH): We saw PVH setting up an inverted head and shoulders pattern from mid-summer through mid-October. Indeed, the right shoulder was a smaller inverted head and shoulders pattern in itself. As it looked ready to break higher in the shoulder, we put it on the report.
On Oct. 21, PVH broke higher off the shoulder. As a result, we moved in with December $90.00 calls at $6.00 when the stock was at $89.38.
PVH continued higher with a strong move during the next session, tested and made another strong move . . . and then pulled back during the last few sessions in October. It held the support, however, and shot higher to a new recovery high by Tuesday. On Thursday, PVH gapped higher and broke through the 200-day simple moving average (SMA).
As it then started to falter, we took the gain by selling the options for $11.75 and banking a nice 95% gain.
Receive a risk-free trial to Investment House Daily and save 50% by clicking here now!
Here is one completed trade from the Success Trading Group, offering insights into our trading strategy and the target that we have hit this week:
NASDAQ:PTEN (Patterson-UTI Energy, Inc.)
We were watching oil stocks as many have formed good patterns and were starting to break upside. PTEN looked great as it had plenty of momentum in late October. It broke through the 50-day moving average (MA) on Oct. 25 and kept going on Oct. 28.
We moved in with some stock at $9.36 -- just in time to see PTEN fade that move and continue to fade into Halloween. After the gremlins left, it jumped higher on Nov. 2 and surged again on Monday. As this move took PTEN to our target, we sold the stock for $9.56 and a 2% gain.
These are examples of what you'll get by becoming a member of Success Trading Group. The system is geared towards bringing you consistent, short-term gains of 5-10% and you can expect four to six trades every month.
To receive a risk-free trial and save 50%, click here now.
3. Pick of the Week
COST (Costco--$299.18; +2.36; optionable)
EARNINGS: 01/02/2020
STATUS: Cup w/handle. As it tested the 50-day MA in August during that selling, COST formed a cup base and then jumped higher late in the month. It then rallied to a new high in early September. After that run, COST peaked and needed a break to rest and base out. Although it fell back to the 50-day MA in early October, it had started higher. Thus, we played that move up and banked some decent gains.
After another peak in late October just below the September high, COST has faded over the past two weeks and held at the 20-day EMA and the rising 50-day MA. Since then, a nice handle has formed on low volume. On Thursday, COST showed a doji with tail, tested near the 50-day SMA and rebounded on a shot of solid volume. Indeed, there was some buying off of that test. On Tuesday, there was a nice upside move on rising trade.
We want to play a breakout from this pattern for the initial run and perhaps further. Unlike many current leaders, COST has put in a nice base and has not rallied or become extended. That gives us the confidence to make the play. We want to move in on a break upside through the entry that holds the move. A rally to the target will give us a gain of 65% on the call options.
VOLUME: 1.761M Avg Volume: 2.051M
BUY POINT: $300.27 Volume=2.2M Target=$314.98 Stop=$295.24
POSITION: COST JAN 17 2020 300.00C - (52 delta)
To see the COST chart, click here!
To receive all of Jon's picks in Investment House Daily, click here now to start your risk-free trial and save 50%!
4. Covered Call Options Play
Compugen Ltd.(NASDAQ:CGEN) -- Compugen Ltd. is currently trading at $5.29. The Dec. 21 $5.00 Calls (CGEN20191221C00005000) are trading at $0.65. That provides a return of about 14% if CGEN is above $5.00 by the expiration.
Learn more about our Covered Call Tables here!
Monday, November 04, 2019
Weekender 11/3
1. Market Summary
A New Day, A New Fed Rate Cut
– Stocks were sluggish the day after the Federal Open Market Committee (FOMC) meeting and recovered decently.
– Trade worries and a weak Chicago Purchasing Management Index (PMI) trumped more solid earnings.
– The S&P 500 bumped the 2018 trend line when the indices slid laterally after the three-week move.
– Volume jumped as indices showed some churn below the old highs.
– The leaders in the chip, machinery and financial sectors underwent very nice pullbacks.
– With regards to the Friday jobs report, the General Motors strike took most of the blame for any shortfalls.
A post-FOMC hangover, concerns about the Fed’s support of the market, renewed trade worries, an abysmal Chicago PMI report and pre-jobs report jitters were all blamed for Thursday's lethargy. Could it have been caused by the fact that, at least in some small part, the indices had rallied three weeks into earnings and the FOMC meeting and now needed a breather? Just maybe? Of course.
Stocks started lower outside of the NASDAQ as that index rose thanks to early gains in the share prices of Apple and Facebook following their earnings results. As soon as the session started, however, stocks started to slide. Even the NASDAQ was not immune. At 9:45 ET, when the Chicago PMI showed a plunge in manufacturing activity (43.2 vs. 48.2 expected vs. the previous value of 47.1), the selling continued to increase over the following 45 minutes. Stocks hit a session low at that point.
That is, they hit a low, but did not surge back upward. After a 40-minute bounce, they sold again, holding just over the earlier low. Then, they wandered in a range until the last half hour saw a couple of buying spurts. That took some of the sting off the downside.
Chart Analysis:
S&P 500: It sold to near the 10-day exponential moving average (EMA) for the second session and rebounded to close the session. Nordstrom, Inc. (JWN) remains near the 2018 trend line which held all prior moves to that level in check. While this was not a positive Thursday, it was not a bad recovery after a second shakeout.
NASDAQ: It tested lower toward the 10-day and rebounded to close lower in the recent post-Monday gap range. Indeed, it closed just below its all-time highs.
NOTE: The figures and information above are from the 10/31 report.
Watch the Investment House Videos For This Week Here!
NOTE: The videos were from 10/30 report. This time, there were only two videos.
2. Targets Hit
Here are three completed trades from Investment House Daily, offering insights into our trading strategy and the targets that we have hit this week:
Cirrus Logic, Inc. (NASDAQ:CRUS): We always keep an eye on semiconductor stocks, particularly when the PHLX Semiconductor Sector (SOX) is setting up for a move higher. CRUS was in such a trading range and even putting in a higher low there. Since this is usually something that happens right before a breakout, we put a play on CRUS in mid-October. On Oct. 21, it made the break higher. Thus, we picked up some stock for $57.59 and some Nov. $55.00 call options for $4.50.
CRUS then faded for one more test of the 20-day moving average (MA) and put in a higher low in the range again. That was the last such low. CRUS moved up from there starting on Monday, edged upside through Wednesday and finally gapped higher and surged from $58.50 to just over $69.00 on Thursday. Since this was a big move and we had November options, it was a no-brainer.
We sold the stock for $68.04 and banked an 18.15% gain. We also sold the November options for $12.00 and banked a 166% gain.
Facebook Inc. (NASDAQ:FB): We picked up FB on Oct. 15 as we were looking for a run into its earnings after the markets closed on Oct. 30. At the time, the stock was breaking upside through the 50-day MA and looked very good. As a result, we bought November $185.00 call options for $8.00 on the move. Initially, the stock looked great as it had a solid upside volume. While FB then continued higher, it dropped to the 50-day MA on the fourth day. It bounced and then crashed the 50-day MA on Oct. 22. Given that FB held the upper gap point from earlier in the month, we left it to work.
FB then rebounded for a week. This took it up near the time of the earnings reports. By this point, FB was showing a very nice inverted head and shoulders pattern at the bottom of a sell-off from July. This is a very reliable upside pattern. With the coming of earnings, however, even a good pattern can end up being sold.
We sold half our position for $8.90 just before earnings were released and banked a very modest 11%. We held the rest, however, based upon the pattern. FB beat earnings expectations and then gapped higher on Thursday. Then, the stock ran quickly over $197.00 and started to falter.
We sold the remaining half of the options for $13.00 and banked a gain of 62%. While this course of action was a bit sloppy, it finally got us to where we needed to be.
Stericycle Inc. (NASDAQ:SRCL): In general, a choppy market requires some patience, but not too much. SRCL was breaking higher at the end of September and came off a nice doji test of the 50-day MA. On Oct. 1, we picked up some stock for $51.38 and some Nov. $50.00 calls for $4.00.
While SRCL immediately fell back to test the 200-day simple moving average (SMA) on the lows, it held and rebounded each session. It then found its footing and gapped upside. SRCL broke to a higher recovery level on Oct. 20 and then tested back to the 10-day EMA. It then stayed there for a week. On the following Thursday, it got the upside gap and rally we were looking for. Thus, it hit our target as it rallied over $59.00 on the high.
Since it then started to falter, we sold the stock for $58.38 and a 13% gain. Concurrently, we sold the November options for $8.50 and banked a 112% gain.
Receive a risk-free trial to Investment House Daily and save 50% by clicking here now!
3. Pick of the Week
PANW (Palo Alto Networks--$226.98; +2.38; optionable): Security software
EARNINGS: 12/04/2019
STATUS: This stock looks to be starting to work on a handle to a six-month double bottom with a handle base. Although a big base can yield big moves, we may need a couple more sessions to complete the handle. However, since an opportunity may be getting close, we want to be ready when PANW makes a break higher. A move to the target will give us a gain of around 75% on the options.
VOLUME: 621.623K Avg Volume: 1.113M
BUY POINT: $227.97 Volume=1.4M Target=$245.97 Stop=$221.96
POSITION: PANW JAN 17 2020 230.00c - (50 delta)
To see the PANW chart, click here!
To receive all of Jon's picks in Investment House Daily, click here now to start your risk-free trial and save 50%!
4. Covered Call Options Play
Funko Inc. (NASDAQ:FNKO) -- Funko Inc. is currently trading at $18.00. The Dec. 21 $17.50 Calls (FNKO20191221C00017500) are trading at $1.40. That provides a return of about 12% if FNKO is above $17.50 by the expiration.
Learn more about our Covered Call Tables here!
Monday, October 28, 2019
Weekender 10/27
1. Market Summary
Excerpted from Thursday's paid content of "Investment House Daily" by Jon Johnson.
Tech Day Has Come!
– Earnings and Fed liquidity were able to overcome the weak economic data.
– Durable goods capital expenditures are the lowest they've been since 2016.
– Repurchase agreements injected $134 billion into the system on Thursday as the Fed has continued to provide huge amounts of liquidity.
– Large-cap indices are back up to their prior highs with a gap to a doji.
– Amazon reported a miss on earnings that drove the stock down 120 points.
– We are still awaiting the break to show the next direction that the market will take. The Fed liquidity says it should happen, but we still have to see it.
Thursday was tech day. However, even though the other areas of the market did not roll over (though retail looks ready for a pullback), they mostly took a pause. Machinery, financial, manufacturing and materials were all softer after solid upside moves.
Money took a breather from moving to those areas and moved into tech-related areas instead. Software (Microsoft beat forecasts), chips (Lam Research Corporation beat expectations while Applied Materials just surged) and some miscellaneous NASDAQ stocks had good -- and bad -- days. For instance, while Tesla and PayPal had a good day, Twitter had a bad day. After hours, while Intel had a good day, Amazon had a bad one.
The earnings reports from Microsoft (MSFT), Intel (INTC) and the Lam Research Corporation (LRCX) were solid enough and the PHLX Semiconductor Sector (SOX) was able to gap back over the April closing high and rally back upward. It is definitely not dead yet. After Texas Instruments' (TXN) destruction due to its earnings, LRCX and Intel more than filled the void.
Chart Analysis:
S&P 500: It gapped upside to test near the September and July highs and then faded a bit off the intraday high. While it is up for sure, this fact does not change anything as the S&P 500 is still below its prior highs and has yet to make the next definitive move.
NASDAQ: It gapped, tested and rebounded to close at the recent highs. However, it is still below the August-September high and the July all-time high. AMZN likely won't help much and INTC, while jumping at first, faded during much of the NASDAQ's movement. Will this be a gap higher that is met with a gap lower? We will see.
AMZN can rebound when those who are dying to get in see an opportunity. While this may be a play that we want to make, the options will still be extremely high in volatility. Thus, we will need to see the implied volatility back off in order make money through buying shares. While selling the premium is a possibility, since the stock price is what it is, this strategy would only be possible with a spread where an investor sold some strikes and bought others.
NOTE: The figures and information above are from the 10/24 report.
Watch the Investment House Videos For This Week Here!
NOTE: The videos are from the 10/23 report.
2. Targets Hit
Here are three completed trades from Investment House Daily, offering insights into our trading strategy and the targets that we have hit this week:
Cummins Inc. (NASDAQ:CMI): As machinery saw money rotating its way, some of the industrial stocks rallied as other areas were being sold. While we didn’t catch CMI on day one of the move, we did catch it as it broke out over its resistance in mid-October. The stock gapped higher on Oct. 11 and tested on Oct. 14. Then, we put it on the report. On Oct. 15, the stock cleared the September high. Thus, we moved in with some November $165 call options at $5.30. Subsequently, CMI rallied straight up to the July peak and hit our target on Oct. 21.
We then sold half the options for $9.00 and banked a 69.8% gain. We also were willing to let CMI show if it was able to move higher. While it rallied a bit more through Wednesday, it threw a doji on Thursday. After 12 sessions of upside in a straight run to the prior highs, we still had our November options. As earnings were scheduled for Oct. 29, the situation was not likely going to get much better. Thus, we took the benefits from the move by selling the rest of the options for $11.90 and banking a gain of 125%.
Inmode Ltd. (NASDAQ:INMD): We saw INMD forming its first base after rallying to an initial peak in September. INMD then rallied off the lows and made a nice low volume test of the 10-day exponential moving average (EMA). After it showed a doji on Oct. 18, we put it on the report that weekend. On Monday, it broke higher and we bought stock (but no options) for $27.54. Then, INMD stepped right up to the target and hit it on Oct. 23. We sold half of the position for $31.85 and banked a 15.6% gain. We then left half of the position to work because this was a new issue that was showing a great course of action after its first base. This type of stock can produce very strong continuing rallies.
U.S. Concrete, Inc. (NASDAQ:USCR): While materials are not that sexy in terms of what they do, when they make you money, they take on a whole new light. We saw USCR setting up a short double bottom at the 50-day EMA after a surge in September. We put it on the report on Oct. 16 as it showed some buying off of that EMA. During the next session, the stock jumped and we entered by buying stock at $51.21 and some November $50 calls for $4.10. USCR posted a very solid four-session rally right up to our target (the prior rally's high) and hit it on Oct. 22. We sold our stock for $54.92 and banked a gain of 7.2%. Concurrently, we also sold our options for $5.50 and banked a gain of 34%. While this is not a huge return, it was a simple play that earned easy money.
Receive a risk-free trial to Investment House Daily and save 50% by clicking here now!
Here are two completed trades from the Success Trading Group, offering insights into our trading strategy and the targets that we have hit this week:
NASDAQ:NVDA (Nvidia Corp.)
We entered this position on Oct. 21 for $195.83 as NVDA started higher off a 10-day EMA one-two-three test of the breakout that occurred during the middle of the month. This trajectory looked super. Indeed, on Oct. 22, NVDA surged and hit our target. We sold our shares for $202.45 and a 3.38% gain. Since NVDA reversed that gain during that very session and tested back to the 10-day EMA, we are watching to see if we can run this play once again.
NASDAQ:AMAT (Applied Materials, Inc.)
We entered this play on Oct. 15 at $52.83 and sold our shares on Oct. 24 for $53.91. This is a 2.04% gain. That is, we entered our AMAT position when it broke higher during the middle of the month. Then, the chip volatility hit. The stock made a quick test of the 50-day moving average (MA) and then gapped upside and to the target.
These are examples of what you'll get by becoming a member of Success Trading Group. The system is geared towards bringing you consistent, short-term gains of 5-10% and you can expect four to six trades every month.
To receive a risk-free trial and save 50%, click here now!
3. Pick of the Week
EXPE (Expedia--$138.31; +1.66; optionable)
EARNINGS: 11/06/2019
STATUS: EXPE peaked from June through July and then faded into early August to start the current cup with handle base. Two weeks ago, the stock used the 50-day MA as support to break higher with a rally and gap. Then, a nice lateral handle formed along the 10-day EMA to fill that upside gap. On Wednesday, EXPE moved higher on a rising average volume. Now, it looks as if EXPE is ready to make the break from the handle. We want to play a continued move up through the buy point on Thursday as a move to the target will provide a solid 80% gain on the call options.
VOLUME: 1.106M Avg Volume: 1.261M
BUY POINT: $138.54 Volume=1.5M Target=$146.98 Stop=$135.71
POSITION: EXPE DEC 20 2019 140.00C -- (49 delta)
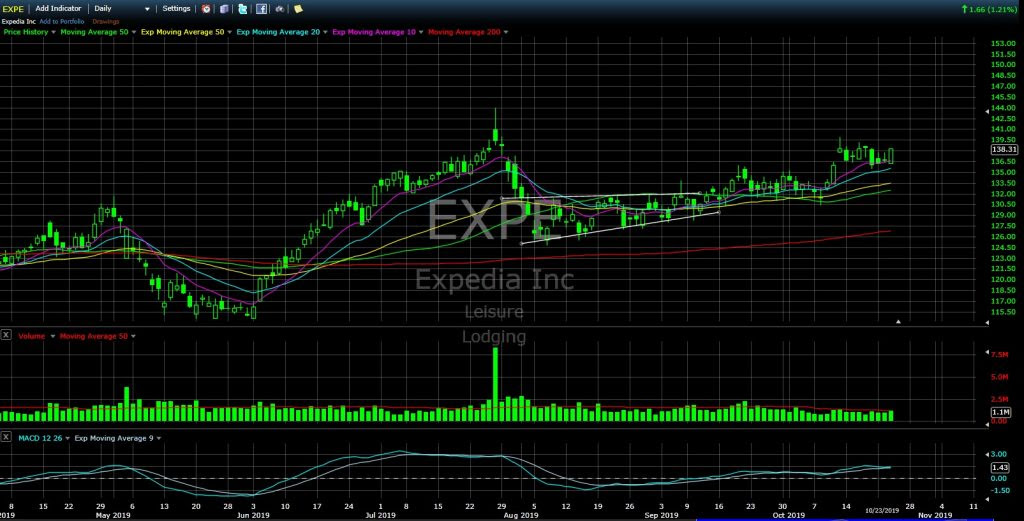
To receive all of Jon's picks in Investment House Daily, click here now to start your risk-free trial and save 50%!
4. Covered Call Options Play
Star Bulk Carriers Corp.(NASDAQ:SBLK) -- Star Bulk Carriers Corp. is currently trading at $11.23. The Dec. 21 $10.00 Calls (SBLK20191221C00010000) are trading at $1.40. That provides a return of about 18% if SBLK is above $10.00 by the expiration.
Learn more about our Covered Call Tables here!
Excerpted from Thursday's paid content of "Investment House Daily" by Jon Johnson.
Tech Day Has Come!
– Earnings and Fed liquidity were able to overcome the weak economic data.
– Durable goods capital expenditures are the lowest they've been since 2016.
– Repurchase agreements injected $134 billion into the system on Thursday as the Fed has continued to provide huge amounts of liquidity.
– Large-cap indices are back up to their prior highs with a gap to a doji.
– Amazon reported a miss on earnings that drove the stock down 120 points.
– We are still awaiting the break to show the next direction that the market will take. The Fed liquidity says it should happen, but we still have to see it.
Thursday was tech day. However, even though the other areas of the market did not roll over (though retail looks ready for a pullback), they mostly took a pause. Machinery, financial, manufacturing and materials were all softer after solid upside moves.
Money took a breather from moving to those areas and moved into tech-related areas instead. Software (Microsoft beat forecasts), chips (Lam Research Corporation beat expectations while Applied Materials just surged) and some miscellaneous NASDAQ stocks had good -- and bad -- days. For instance, while Tesla and PayPal had a good day, Twitter had a bad day. After hours, while Intel had a good day, Amazon had a bad one.
The earnings reports from Microsoft (MSFT), Intel (INTC) and the Lam Research Corporation (LRCX) were solid enough and the PHLX Semiconductor Sector (SOX) was able to gap back over the April closing high and rally back upward. It is definitely not dead yet. After Texas Instruments' (TXN) destruction due to its earnings, LRCX and Intel more than filled the void.
Chart Analysis:
S&P 500: It gapped upside to test near the September and July highs and then faded a bit off the intraday high. While it is up for sure, this fact does not change anything as the S&P 500 is still below its prior highs and has yet to make the next definitive move.
NASDAQ: It gapped, tested and rebounded to close at the recent highs. However, it is still below the August-September high and the July all-time high. AMZN likely won't help much and INTC, while jumping at first, faded during much of the NASDAQ's movement. Will this be a gap higher that is met with a gap lower? We will see.
AMZN can rebound when those who are dying to get in see an opportunity. While this may be a play that we want to make, the options will still be extremely high in volatility. Thus, we will need to see the implied volatility back off in order make money through buying shares. While selling the premium is a possibility, since the stock price is what it is, this strategy would only be possible with a spread where an investor sold some strikes and bought others.
NOTE: The figures and information above are from the 10/24 report.
Watch the Investment House Videos For This Week Here!
NOTE: The videos are from the 10/23 report.
2. Targets Hit
Here are three completed trades from Investment House Daily, offering insights into our trading strategy and the targets that we have hit this week:
Cummins Inc. (NASDAQ:CMI): As machinery saw money rotating its way, some of the industrial stocks rallied as other areas were being sold. While we didn’t catch CMI on day one of the move, we did catch it as it broke out over its resistance in mid-October. The stock gapped higher on Oct. 11 and tested on Oct. 14. Then, we put it on the report. On Oct. 15, the stock cleared the September high. Thus, we moved in with some November $165 call options at $5.30. Subsequently, CMI rallied straight up to the July peak and hit our target on Oct. 21.
We then sold half the options for $9.00 and banked a 69.8% gain. We also were willing to let CMI show if it was able to move higher. While it rallied a bit more through Wednesday, it threw a doji on Thursday. After 12 sessions of upside in a straight run to the prior highs, we still had our November options. As earnings were scheduled for Oct. 29, the situation was not likely going to get much better. Thus, we took the benefits from the move by selling the rest of the options for $11.90 and banking a gain of 125%.
Inmode Ltd. (NASDAQ:INMD): We saw INMD forming its first base after rallying to an initial peak in September. INMD then rallied off the lows and made a nice low volume test of the 10-day exponential moving average (EMA). After it showed a doji on Oct. 18, we put it on the report that weekend. On Monday, it broke higher and we bought stock (but no options) for $27.54. Then, INMD stepped right up to the target and hit it on Oct. 23. We sold half of the position for $31.85 and banked a 15.6% gain. We then left half of the position to work because this was a new issue that was showing a great course of action after its first base. This type of stock can produce very strong continuing rallies.
U.S. Concrete, Inc. (NASDAQ:USCR): While materials are not that sexy in terms of what they do, when they make you money, they take on a whole new light. We saw USCR setting up a short double bottom at the 50-day EMA after a surge in September. We put it on the report on Oct. 16 as it showed some buying off of that EMA. During the next session, the stock jumped and we entered by buying stock at $51.21 and some November $50 calls for $4.10. USCR posted a very solid four-session rally right up to our target (the prior rally's high) and hit it on Oct. 22. We sold our stock for $54.92 and banked a gain of 7.2%. Concurrently, we also sold our options for $5.50 and banked a gain of 34%. While this is not a huge return, it was a simple play that earned easy money.
Receive a risk-free trial to Investment House Daily and save 50% by clicking here now!
Here are two completed trades from the Success Trading Group, offering insights into our trading strategy and the targets that we have hit this week:
NASDAQ:NVDA (Nvidia Corp.)
We entered this position on Oct. 21 for $195.83 as NVDA started higher off a 10-day EMA one-two-three test of the breakout that occurred during the middle of the month. This trajectory looked super. Indeed, on Oct. 22, NVDA surged and hit our target. We sold our shares for $202.45 and a 3.38% gain. Since NVDA reversed that gain during that very session and tested back to the 10-day EMA, we are watching to see if we can run this play once again.
NASDAQ:AMAT (Applied Materials, Inc.)
We entered this play on Oct. 15 at $52.83 and sold our shares on Oct. 24 for $53.91. This is a 2.04% gain. That is, we entered our AMAT position when it broke higher during the middle of the month. Then, the chip volatility hit. The stock made a quick test of the 50-day moving average (MA) and then gapped upside and to the target.
These are examples of what you'll get by becoming a member of Success Trading Group. The system is geared towards bringing you consistent, short-term gains of 5-10% and you can expect four to six trades every month.
To receive a risk-free trial and save 50%, click here now!
3. Pick of the Week
EXPE (Expedia--$138.31; +1.66; optionable)
EARNINGS: 11/06/2019
STATUS: EXPE peaked from June through July and then faded into early August to start the current cup with handle base. Two weeks ago, the stock used the 50-day MA as support to break higher with a rally and gap. Then, a nice lateral handle formed along the 10-day EMA to fill that upside gap. On Wednesday, EXPE moved higher on a rising average volume. Now, it looks as if EXPE is ready to make the break from the handle. We want to play a continued move up through the buy point on Thursday as a move to the target will provide a solid 80% gain on the call options.
VOLUME: 1.106M Avg Volume: 1.261M
BUY POINT: $138.54 Volume=1.5M Target=$146.98 Stop=$135.71
POSITION: EXPE DEC 20 2019 140.00C -- (49 delta)
To receive all of Jon's picks in Investment House Daily, click here now to start your risk-free trial and save 50%!
4. Covered Call Options Play
Star Bulk Carriers Corp.(NASDAQ:SBLK) -- Star Bulk Carriers Corp. is currently trading at $11.23. The Dec. 21 $10.00 Calls (SBLK20191221C00010000) are trading at $1.40. That provides a return of about 18% if SBLK is above $10.00 by the expiration.
Learn more about our Covered Call Tables here!
Monday, October 21, 2019
Weekender 10/20
1. Market Summary
Excerpted from Thursday's paid content of "Investment House Daily" by Jon Johnson.
Not A Major Revival, But Not A Terrible One
– There has been no surge by the large-cap indices.
– The good news from earnings and Brexit have been offset by news regarding Housing Starts, the Philly Fed and industrial production.
– The economic data are not that great, but the Fed is still there.
– Repurchase agreement (repo) action has been subscribed at $104.2 billion as the need for them has jumped.
– Small- and mid-caps have rallied nicely as the large-cap indices have paused at the prior highs.
– We have seen a bit of a large-cap test while the small- and mid-cap rally showed good market action.
The economic news was lacking. For instance, the Philly Fed posted 5.6, lower than the 6.0 expected and the 12 that it had posted back in September. Housing starts for September fell 9.4%, crushing the -3.2% that was expected and marking its lowest reading in years. Industrial production slipped to -0.4, more than the 0.3 that was expected and the 0.8 that was reported back in August. Capacity missed at 77.5 and was down from 77.9.
A reported breakthrough in the Brexit talks has been made, but questions are still circulating as to whether Parliament will approve it.
Surely the Fed can help. With the economic data smelling the place up, some sort of action would seem appropriate for a Fed that has a rate-cutting bias. Even so, a story has been circulating that the Fed may be inclined to pause its cuts at the next session. Really? And if so, would it matter?
I would just like to add another note regarding the repurchase agreements. After all, the Fed’s latest overnight repo action, one with a $75 billion limit, was oversubscribed at $104.2 billion. I am so glad the Fed is on the case -- the need for funds has declined dramatically. Not! It has suddenly ramped back up after we were told all was well and after it had stabilized at around $30 billion. Once the new facility was in place in October, all would be fine . . . Sure.
Something is wrong beyond just the structural changes in the system that the Fed is citing as the source of the need for repo operations.
Chart Analysis: In order to look past the gains, you also have to look at the action. The indices basically stalled for a second session after the Tuesday surge. That move left the S&P 500, the NASDAQ and the DJ30 (the large-cap indices) below their September peaks and thus below the all-time highs that they set back in July. The S&P400 and the smaller-cap indices posted solid moves that . . . leave them still well off their prior highs. At least they are now in the upper half of their trading ranges.
It was not the surge that the recent pattern suggested, e.g. big move, pause, big move, pause. It was a move higher and that was about it. One could argue that after a couple of weeks of upside to the penultimate highs for the NASDAQ and DJ30 and the highs for the S&P 500 and the PHLX Semiconductor Sector (SOX), the market needed more to push it. The large-caps, however, were not the center of the action. Instead, the S&P 400 mid-caps rallied 0.85% and moved higher in the range. Unlike the other indices, the S&P 400 did not give back its gains.
NOTE: The figures and information above are from the 10/17 report.
Watch the Investment House Videos For This Week Here!
NOTE: The videos are from the 10/16 report.
2. Targets Hit
Here are two completed trades from Investment House Daily, offering insights into our trading strategy and the targets that we have hit this week:
Endo International plc (NASDAQ:ENDP): We always watch for stocks that are "turning the corner," i.e. those that have been in long uptrends or downtrends and are breaking out of them. We saw some pharmaceutical companies in this status, one of them being ENDP. It broke over the 50-day moving average moving average in early September, rallied a bit and then spent a month testing the break over that key level. We put it on the report on Oct. 2 as it started to edge up off the 50-day moving average test. On the next day, it made a break and we entered by purchasing stock positions at $3.60.
ENDP continued to move higher into Oct. 7. Nice. Then, it faded during the next week and came back to the 50-day exponential moving average (EMA). It then tested on low volume and held that support. Then, it got interesting. After that second test and a higher low, ENDP shot higher on Oct. 16. While it touched our target, it was so strong that we left it to continue working.
ENDP faded into the close a bit. On Oct. 17, it rallied again to a higher high early on and then started to stall. We locked in a 28% gain because we started to sell at $4.61. While this was not bad, if we had sold just half of our shares, we would have had half to rally to $5.20 during that session and bank another 44%. While we usually do that, given the course of action during the prior session, we did not want to see that early high pushed back. While we are happy enough with the gain, we are disappointed we did not play the stock the way we really should have...
Health Insurance Innovations Inc. (NASDAQ:HIIQ): Now, this is one of the stocks that we played as we should have. We originally entered on Sept. 26 with some stock at $23.85 and November $25.00 calls for $2.80. HIIQ rallied right on up to the initial target on Oct. 3 and we banked half our position for a 9% stock and 28% option gain. While this is a decent gain, we wanted to get our money in the bank. Thus, we left half the position to work.
After that initial rally, HIIQ tested the 10-day EMA and the 20-day EMA on Oct. 8. It rebounded during the intraday period and could have spent more sessions at that level. Then, it shot higher over the course of the week to the 200-day simple moving average (SMA).
After it moved through the SMA, the stock failed. Then, it moved through the SMA again and started to fail again. The 200-day SMA was obviously acting as resistance. We decided to sell the rest, figuring that if it the stock ends up breaking the 200-day MA, we can move in with a new position. We then sold the rest of the stock for $26.85 and a 12% gain. We also sold the options for $4.20 and a 50% gain. In this back and forth market, this strategy worked.
Receive a risk-free trial to Investment House Daily and save 50% by clicking here now!
Here is a completed trade from the Success Trading Group, which offers insights into our trading strategy and the target that we have hit this week:
NASDAQ:FB (Facebook, Inc.)
We saw Facebook improving with a double bottom off the 200-day moving average before approaching the 60-day moving average. On Oct. 15, it broke over the 50-day moving average and we entered with a stock position at $186.92. Then, Facebook rose higher. On Thursday, Oct. 17, it gapped to a doji and hit our initial target at $190.66. Given the doji gap, we opted to go ahead and bank a quick and easy 2% gain.
This is an example of what you'll get by becoming a member of Success Trading Group. The system is geared towards bringing you consistent, short-term gains of 5-10% and you can expect four to six trades every month.
To receive a risk-free trial and save 50%, click here now.
3. Pick of the Week
NVDA (Nvidia Corp. -- $185.99; +2.96; optionable)
EARNINGS: 11/14/2019
STATUS: We started looking at NVDA again when it bumped the highs from both the prior week and from early September. Indeed, NVDA broke out of a large triangle in early September and then rallied by testin back to the 50-day moving average (MA) in late September and early October. It then made a move back up from there. While trading was choppy last week, the stock held the 20-day EMA and rebounded into Friday. If NVDA can continue this move, we can move in. A rally to the target will give us a gain of around 45% on the call options.
VOLUME: 11.272M Avg Volume: 8.48M
BUY POINT: $186.58 Volume=1.2M Target=$196.94 Stop=$183.21
POSITION: NVDA DEC 20 2019 185.00C -- (56 delta)
To receive all of Jon's picks in Investment House Daily, click here now to start your risk-free trial and save 50%!
4. Covered Call Options Play
Akoustis Techs. Inc. (NASDAQ:AKTS) -- Akoustis Techs. Inc. is currently trading at $8.22. The Dec. 21 $7.50 Calls (AKTS20191221C00007500) are trading at $1.10. That provides a return of about 16% if AKTS is above $7.50 by the expiration.
Learn more about our Covered Call Tables here!
Monday, October 14, 2019
Weekender 10/13
1. Market Summary
Excerpted from Thursday's paid content of "Investment House Daily" by Jon Johnson.
Positive Trade Talk News Leads Market Revival
- Positive trade vibes helped lift stocks after President Trump said that the trade negotiators would meet on Friday.
- Indices still backed off from their near resistance after the news regarding the trade war was revealed.
– After hours, we were told that the meetings were going "very well." Futures rose.
– On Friday, stocks were set to start near the session highs at the 50-day moving average (MA).
– Will the news be good enough for the market?
Call me a skeptic (you can), but the market move on Thursday left unanswered questions in its wake. Of course it would as the market moved on the trade headlines all Wednesday night and on Thursday as well.
President Trump also commented that he was meeting with the Vice-Premier of the State Council of the People's Republic of China on Friday. Since the meeting was not cancelled, stocks jumped. After trading hours were finished, President Trump commented that the trade talks were going very well. Dow futures jumped near 100 points.
Either there is a big setup in progress or the United States is going to concede to a partial deal which includes that currency pact. On the other hand, perhaps the United States will forgo the tariff increases and a few other make-nice elements in return. This will leave the hard parts for later, aka never. Either way is a setup because President Trump said that there would be no partial deal. Will he care? Probably not, but some of the individuals in his political base who had backed him when we could have had a milquetoast agreement early on will likely be very angry. For instance, the farmers who suffered but felt it was the right thing to do form one of these potentially angry groups.
The S&P 500, the DJ30 and the NASDAQ: These indices are lumped together because they are still the same. During the last trading session, all of them climbed back to resistance at the 50-day MA and all of them faded from that session high to close below their respective 50-day MA. After-hours Dow futures are up 30 points, S&P 500 futures are up by three points and NASDAQ futures are up 14 points. Even so, they are still down from where they were immediately after President Trump’s comments. That leaves them below the session highs and waiting for more news.
NOTE: The figures and information above are from the 10/10 report.
Watch Market Overview Video
Watch Technical Summary Video
Watch Next Session Video
NOTE: The videos are from the 10/9 report.
2. Targets Hit
Here is one completed trade from Investment House Daily, offering insights into our trading strategy and the target that we have hit this week:
Costco Wholesale Corporation (NASDAQ:COST): Costco is a market leader, and when market leaders are following a good trend that is testing the 50-day MA, you should take notice and play the moves. We saw this test and put COST on the report in late September so that we could be ready when COST made its move off the 50-day MA. While this took some time, COST made its move in early October. We picked up the position on Oct. 4 with some November $290 call options for $9.50. While the move started well, it soon slowed.
Although it eventually steadied, COST was only able to fill the downside gap from early September after more than a week of upside. While this was not a bad move under the given circumstances, big news broke on Friday about a possible partial trade deal.
Since COST did not move much on the news, we decided that the prudent thing to do was to bank some gains. We sold half the options for $13.20 and obtained a gain of 39%. While this was not the big gain we were seeking, we wanted to bank some profit and let the rest of the position continue to work higher if it can. Sometimes these types of stocks surge, sometimes they just move in a way that is slow and steady.
Receive a risk-free trial to Investment House Daily and save 50% by clicking here now!
Here is a completed trade from the Success Trading Group which offers insights into our trading strategy and the target that we have hit this week:
Nordstrom, Inc. (NYSE:JWN)
Our Success Trading Group members scored another winning trade when we closed out a position in Nordstrom, Inc. (NYSE: JWN). We bought this stock on Sept. 30 and sold it on Oct. 11 for a 2.39% gain. We are watching several other stocks and are looking forward to trading next week.
Success Trading Group's system is geared towards bringing you consistent, short-term gains and you can expect four to six trades every month.
To receive a risk-free trial and save 50%, click here now.
3. Pick of the Week
AMAT (Applied Materials--$50.84; +1.53; optionable)
EARNINGS: 11/14/2019
STATUS: Triangle. AMAT is showing very good action due to a three-month triangle that formed after a solid June through July move to a higher recovery. This is a solid pattern as it uses the 50-day MA as support for the lower trend line. This move is part of a larger 20-month base that formed off of the March 2018 high. The stock also was coming off of a test of the 50-day MA and showing good volume.
However, there was some resistance at just over $51.00. If AMAT clears that barrier on some good volume (the trading volume was up on Wednesday due to the upside move), we want to pick up a half position and see if it can break out over $52.50. A move to the target will give us a gain of 13% on the stock and a gain of 100% on the options.
VOLUME: 6.279M Avg Volume: 6.986M
BUY POINT: $51.21 Volume=9M Target=$57.97 Stop=$48.96
POSITION: AMAT NOV 15 2019 50.00C -- (55 delta) &/or Stock
To receive all of Jon's picks in Investment House Daily, click here now to start your risk-free trial and save 50%!
4. Covered Call Options Play
Arqule Inc.(NASDAQ:ARQL) -- Arqule Inc. is currently trading at $8.73. The Nov. 16 $8.00 Calls (ARQL20191116C00008000) are trading at $1.50. That provides a return of about 19% if ARQL is above $8.00 by the expiration.
Learn more about our Covered Call Tables here!
Subscribe to:
Posts (Atom)