
|
||
1) MARKET SUMMARY: Excerpted from Thursday's paid content of "The Daily" by Jon Johnson at InvestmentHouse.com. To get his latest information and his daily content, click here now to receive a two-week trial and save $30/month. (You won't find this offer on the Investment House website. It is exclusively for The Weekender subscribers!) Earnings Reporting Season Part II.
|
||
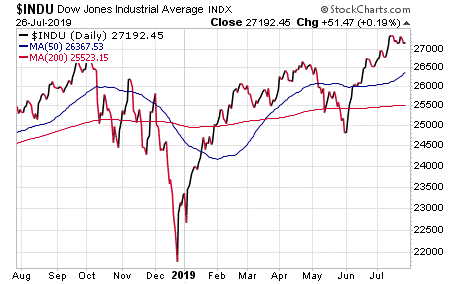
Market Summary (continued from above) After a Wednesday evening with a lot of earnings misses and a Thursday morning with seemingly more misses than hits, stocks came into the session with a stiff upper lip -- and some modest futures gains. Those gains, however, soon began to erode. Mario Draghi at the European Central Bank (ECB) sounded super dovish and promised action. The thing is, he has promised action during each ECB decision for the past several months. Nothing has happened. The central banker who cried "stimulus" failed to rally the market with his sweet words one too many times. Durable Goods Orders for June were stronger than expected from month to month (2.0% vs. 1.0% expected vs. -2.0% in May), and despite June showing the slowest year/year growth in three years, business investment rose 1.9% from 0.3%. As this was a solid advance in a key area, this strength further dampened the already waning enthusiasm regarding the Fed being more aggressive at the Federal Open Market Committee meeting next week. DJ30: The DJ30 faded through the 10-day exponential moving average (EMA) to test the 20-day EMA. As of now, it is currently in the two week range that is holding the breakout. It has the pattern, it just needs its names to step it up. S&P 400: After the Tuesday and Wednesday nice upside moves, the S&P400 faded with the rest of the market. For now, while there might be a test of the move, we don't want to see that good work go for naught. NASDAQ: After a strong break higher to a new high on Wednesday, the NASDAQ gave it all up. The rising volume indicates the status of the distribution and also shows that it has the signs of a reversal, though not a powerful one. Nonetheless, NASDAQ punched out a new high, looked strong and then gave it all back. SOX: The PHLX Semiconductor Sector Index (SOX) faded after experiencing a powerful rally to a new high that opened up with a big move. While the reversal was not bad, it was to be expected. After all, a leader that was very important to the market led the upside with a flurry and then began testing. NOTE: The figures and information above are from the 7/25 report. Watch Market Overview Video Watch Technical Summary Video Watch Next Session Video NOTE: The videos are from the 7/25 report. Here are two trades from "The Daily," offering insights into our trading strategy and the targets that we have hit this week:
Company Profile CYBR was in a lateral move this past week, holding onto its gains after a strong breakout from a two month trading range. Thus, we may want to test some more before resuming the move upward. We might just wait for the next break higher via the buy point that holds the key move. That will be the entry signal for a run to the target and will give us around 50% on the options. GS (NYSE: Goldman Sachs Group Inc.) Company Profile
GS made the seminal move in this rally in late June when it gapped over the 200-day simple moving average (SMA). It consolidated for a week and then rallied into Tuesday. It is now consolidating again in a tight lateral range while it waits for the 10-day EMA to catch up and start the next move upward. We want to play that move to the bottom of the consolidation that was achieved in mid-2018 as that move will give us a return of around 85% on the September options. Targets Hit This Week: Great rallies in leaders on the week, and you know we play the leaders. With such a strong surge in semiconductors, it was time to bank some gain on those plays and with others that tagged along with the chips as they rallied. AMAT: We entered this play on 7/18 by buying the stock at $47.82 and September $46 call options at $3.55. The value of the stock then surged into Thursday and hit our initial target. We banked half of the 77% option gain and a 8.7% stock gain. AVGO: We bought AVGO call options on 7/18 by picking up the September $290 calls for $13.70. After AVGO hit the initial target on 7/24, we sold half the options for $20.30. We banked 48% on that initial run. BBY: While this was not a huge gain, we had to play good patterns that have a high probability of making us money. BBY filled the bill. We first moved in on 7/11 as it broke higher from a cup with handle breakout test and bought some stock for $73.20 and some September strike call options for $5.95. BBY put in a super steady rise through Thursday, started to stall that day, and we sold the position, banking 57% on the options, 6.8% on the stock. Love the no-brainer plays. BYND: This play is still motoring higher, but it hit the initial target, and we stuck to our plan, taking half the gain at that target, letting half run. We bought this one on 7/11 for 169.53 and some September $170.00 strike calls for $12.50. On 7/23, it hit the initial target and we sold our stock for $193.25 and a 14% gain as well as some of the options for $28.70. In total, we banked 129%. On Thursday, BYND was up another 9% on the stock and the options had exploded in value. On Friday, we sold the options for $55 and banked 340%. Then, we sold some more stock for $225.98 and banked 33%. FB: We entered this play on 6/20 with some August $187.50 call options for $5.40. FB rallied steadily into July, hitting our initial target on 7/10. Per the plan, we sold half the calls for $9.10 and banked 68%. FB continued to rally, but then tested. Although we knew that earnings were approaching and our options would expire in August, we wanted to catch a pre-earnings run. FB started upside this week and put in a decent move Monday and a solid one on Wednesday. However, it did not gain much more ground. So, we sold the rest of the options for $9.45 and banked 75%. GOOG: We moved into GOOG on 7/10 for a pre-earnings run and bought the August $1,140.00 options for $34.70 and the stock at $1,140.68. While this was not much of a pre-earnings run, we had planned on holding them anyways. Why? We knew that the earnings had to be better than they were in the prior month and GOOG would make sure they were. Sure enough, it blew out the earnings. We sold the calls on Friday for $123.70, banking 256%. JPM: This one was similar to BBY as it was not that sexy and had a high probability of making us money. We entered on 7/11 by picking up August $115.00 options for $2.23. JPM then broke higher and tested for a week. It then bottomed at the 20-day EMA on Monday's open. JPM then rallied into Thursday's open, which hit our initial target. After a three-day move, we didn't feel that JPM would put in more on that leg. Thus, we sold the options for $3.05, banking a modest 36%. KO: While KO was not sexy, its pattern sure was since KO tested near its support in a flag pattern in mid-June. We moved in on 6/19 as KO broke higher and bought August $50.00 calls for $2.15 when the stock was at $51.21. KO rallied, tested, rallied and tested, but did not make much headway. However, we decided to ride through earnings given the solid pattern and given the fact that food stocks were reporting good sales. KO announced, beat handily and gapped to the upside on Tuesday. We sold the options for $4.30 and banked 100%. LRCX: We bought into LRCX on 7/12 when it broke higher in a base formation and moved up off a 50-day moving average (MA) test. We then bought September $190 call options for $11.20 and stock at $191.21. LCRX was ripe to move, as were most big chips, and it took off to the upside. After a big six-session run, it was at prior highs and due for a test. On Thursday, the stock showed signs of pausing and we sold half the position for $26.80. In total, we banked 139% on the options and 11.7% on the stock. LYV: We bought into LYV on 7/2, when it broke out from a three-month base. We picked up the stock for $67.63 and August $67.50 call options for $2.95. Since LYV put in a steady move up the 10- and 20-day EMA as breakouts do, it hit our initial target on Thursday. We sold half the stock for $72.62 and a 7% gain and half the options for $5.70 and a 93% gain. MCHP: We picked up MCHP on 7/12 for $91.71 and some August $90 strike calls for $5.00. As with most of the big chips, it was pretty much upside from there for a week or more. After it hit our target on 7/25, we sold the stock for $99.50 and a 9% gain as well as our options for $10.50 and gained 110%. NVDA: This one was so-so. We bought it on 7/11 when it broke higher and also picked up some September $165.00 strike calls for $10.70 with the stock at $164.43. NVDA rallied with the big names into Wednesday and hit the initial target. We also banked the options for $15.70 and a 46% gain. SNAP: We bought SNAP on 7/6 for $15.22 along with some August $15.00 strike calls at $1.45. SNAP rallied for a few sessions and then fell back with the social media stocks. We hung with it as we wanted to ride through earnings. It held the 50-day MA, started upside and then earnings gapped it higher on Wednesday. Since that was our target, we gladly banked the 65% options and 13% stock. UCTT: We bought UCTT on 7/22 as it started to break from its triangle by picking up the stock at $14.32 and the September $15.00 strike calls for $0.95. UCTT surged on Wednesday and hit the initial target. We then sold the stock for $15.45 and a $7.9% gain. Alongside this, we sold the options for $1.60 and collected a 68% gain. V: We took up the rest of our V position on the day after earnings. As V managed to put in one more move up for us on the earnings, we sold the last of our options for $9.45 (that we originally bought at $5.40) and banked 75%. XLNX: We bought XLNX shares on 7/12 when it, and many other chips, broke higher. We then picked up the stock for $120.15 and September $120.00 calls for $7.55. XLNX rallied with the chips and hit our target on 7/24. We sold the stock for $132.22 and a 10% gain. We also sold our options for $14.75 and a 95% gain. Receive a two week trial and if you stay on receive a $30 per month discount! |
||
2) IH ALERTS NYSE:SQ SQ (Square--$78.84; +0.27; optionable) Company Profile EARNINGS: 08/01/2019 STATUS: SQ is in the handle of a large 10 month base and its chart has formed something of a cup with a handle or a double bottom with a handle. Either way, the effect is the same with this big base. Its nice break higher started in early June and moved to the 200-day SMA. After spending three weeks there, it experienced a break higher into early July and a rally to the late February interim recovery to its base. Over the past two weeks, SQ has been testing the move and showed a doij pattern on Tuesday. We want to play a new break higher with an initial target that aims at the September 2018 penultimate high, which took place before the high that started this base. This will be an excellent setup to run toward earnings and beyond as we want to play a solid new break higher. A rally to the initial target will give us around 10% on the stock and around 95% on the call options. VOLUME: 3.609M Avg Volume: 7.605M BUY POINT: $79.66 Volume=11M Target=$88.89 Stop=$76.64 POSITION: SQ SEP 20 2019 80.00C -- (49 delta) &/or Stock CHART IMAGE Save $600 per year and enjoy a two week trial of our IH Alerts Service! |
||
3) SUCCESS TRADING GROUP -- by the MarketFN STG Team NYSE:TWTR (Twitter Inc.) Company Profile Our Success Trading Group members scored another winning trade this week when we closed out a position in Twitter Inc. (NYSE:TWTR). We are watching other several stocks and are looking forward to trading next week. Our Success Trading Group closed seven years with zero losses on our Main Trade Table. In fact, we closed 100% winning trades for the calendar years 2016, 2015, 2013, 2012, 2011, 2010 and 2009. We still have one open position from 2017 (all others were winners) and one trade that we opened in 2014 but was closed as a losing trade. All of these trades are posted on our Main Trade Table for your review during your free membership trial period. Get Our Next Trade Free - Save $50 per month! Details Here. |
||
4) COVERED CALL PLAY NASDAQ:CROX -- Crocs, Inc. is currently trading at $19.67. The August 17 $20.00 Calls (CROX20190817C00024000) are trading at $1.20. That provides a return of about 5% if CROX is above $20.00 by the time of the expiration. Company Profile Learn more about our Covered Call Tables |
||
|
||
The foregoing is commentary for informational purposes only. All statements and expressions are the opinions of Online Investment Services, LP., or Split Ventures, Ltd. This information is not meant to be a solicitation or recommendation to buy, sell, or hold securities. We are not licensed or registered in the securities industry. The information presented herein and on the related web site has been obtained from sources believed to be reliable, but its accuracy is not guaranteed. The security portfolios of writers for this issue may, in some instances, include securities mentioned herein and on the related web site. Estimates, assumptions and other forward-looking information are subject to the limits of forecasting. Actual future developments may differ materially due to many factors. No one associated herewith receives compensation in any manner from any of the companies that are discussed in this newsletter or on the related websites. This is a commerical email. It may contain advertisment or solicitation. This email was sent to ~~EMAIL~~. Please click the following link to change or unsubscribe. All Rights Reserved. 300 New Jersey Ave, Suite #500, Washington, DC 20001 |
||
|


No comments:
Post a Comment